Symbols in Development
The following symbols are currently under development and will be released with the next major update of Vision Library+.
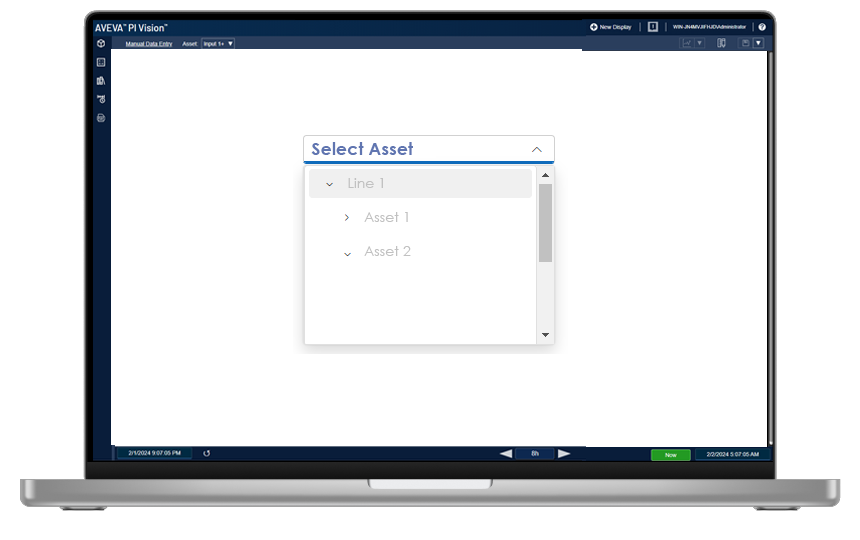
Asset Select
Select your display asset from a dropdown menu list, that supports a tree structure.
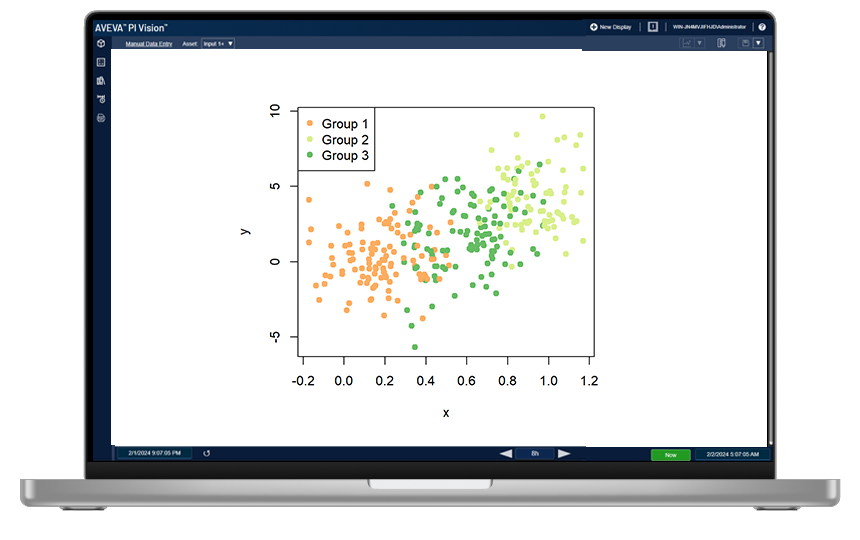
XY Plot
Improved XY-Plot control, add a third dimension for coloring, select data points & more.

Asset Tree Map
Compare your assets attributes in an ingeractive asset tree map.
Planned Symbols
The following symbols are currently planned for a future release of Vision Library+, or were requested from our customers.

Radar Plot
A radar chart displays multivariate data stacked at an axis with the same central point. The chart features three or more quantitative variables for comparison
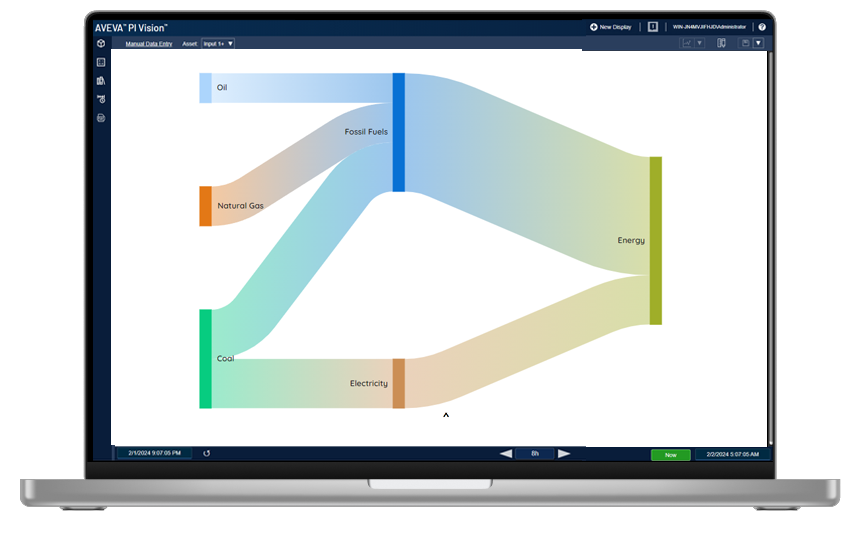
Sankey Diagram
Sankey diagrams are a data visualisation technique or flow diagram that emphasizes flow/movement/change from one state to another or one time to another, in which the width of the arrows is proportional to the flow rate of the depicted extensive property.

Interactive Map
Display your data based on location, with this interactive map control for PI Vision.
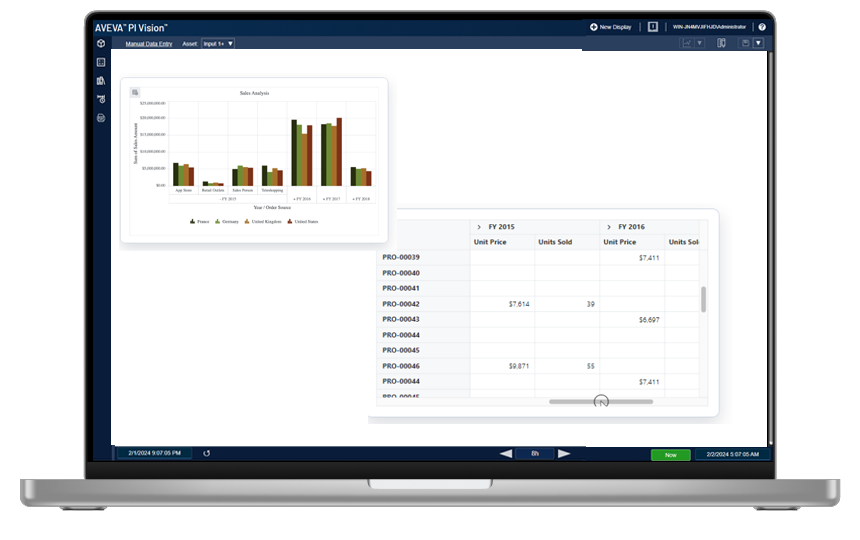
Pivot Table & Chart
The Pivot Table is a powerful control used to organize and summarize business data and display the result in a cross-table format. It includes major functionalities: data binding, drilling up and down, Excel-like filtering and sorting, editing, Excel and PDF exporting, several built-in aggregations, field lists, and calculated fields. A high volume of data can be loaded without any performance degradation by using row and column virtualization.

PDF Viewer
The PDF Viewer is a modular control for viewing and printing PDF files in PI Vision. It provides the best viewing experience available with core interactions such as zooming, scrolling, text searching, text selection and copying text. The thumbnail, bookmark, hyperlink, and table of contents support provides easy navigation within and outside the PDF files.

Range Selector
The Range Selector is an interface for selecting a small range from a larger collection. It will apply the selected time range automatically to the current display.
In Development for existing Symbols
The following enhancements are currently in development for one or multiple of your existing symbols


