Pie Chart+ for AVEVA PI Vision

PI Vision pie chart for shares of a total

See at a glance how each site, line or unit contributes to a total. Pie Chart+ draws PI points and AF attributes as a pie, donut, half-donut or polar chart in your PI Vision display.

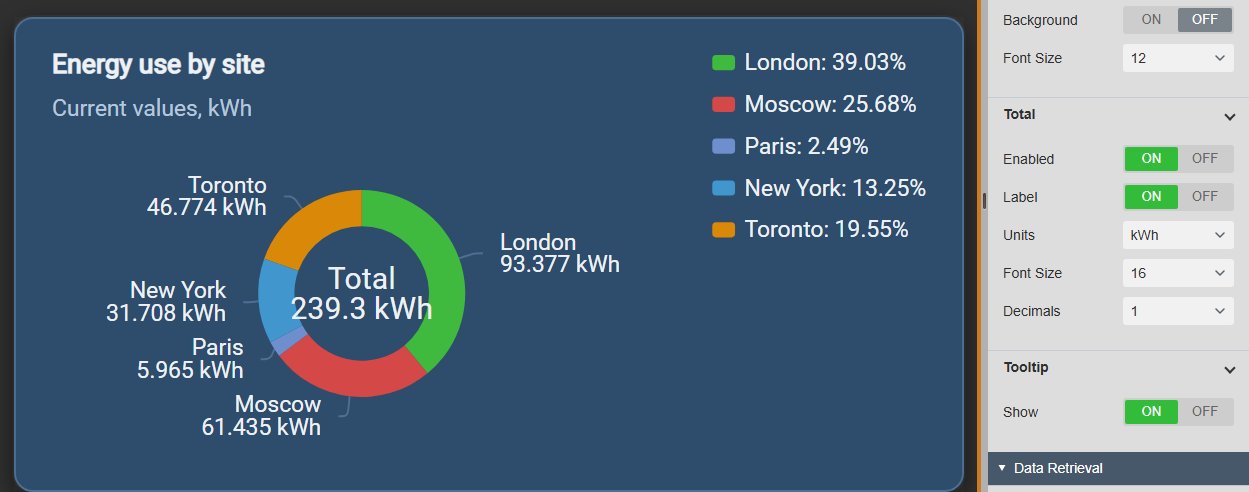
Pie Chart+ in PI Vision showing energy use for five sites as a donut chart with the total of 239.3 kWh in the centre, each slice labelled with the site name and value, and a legend with percentages, next to the Data Labels and Total settings
Pie Chart+ v2.0 in PI Vision: energy use by site as a donut with the total in the centre, next to the Total settings. Demo data. Select the image to enlarge.

Pie, donut, half-donut and polar charts in PI Vision

Pick the layout that fits the space on the display and the question: a classic pie, a donut with the total in the centre, a compact half donut, or polar bars that compare by length.

Four layouts for part-to-whole data

Switch the layout with one click. The data sources, labels and colours stay the same.

  • Pie for a complete part-to-whole view.
  • Donut and half donut with an adjustable inner radius.
  • Polar layout that compares values by radius, with optional grid, scale and custom limits.
  • One slice per PI point or AF attribute.
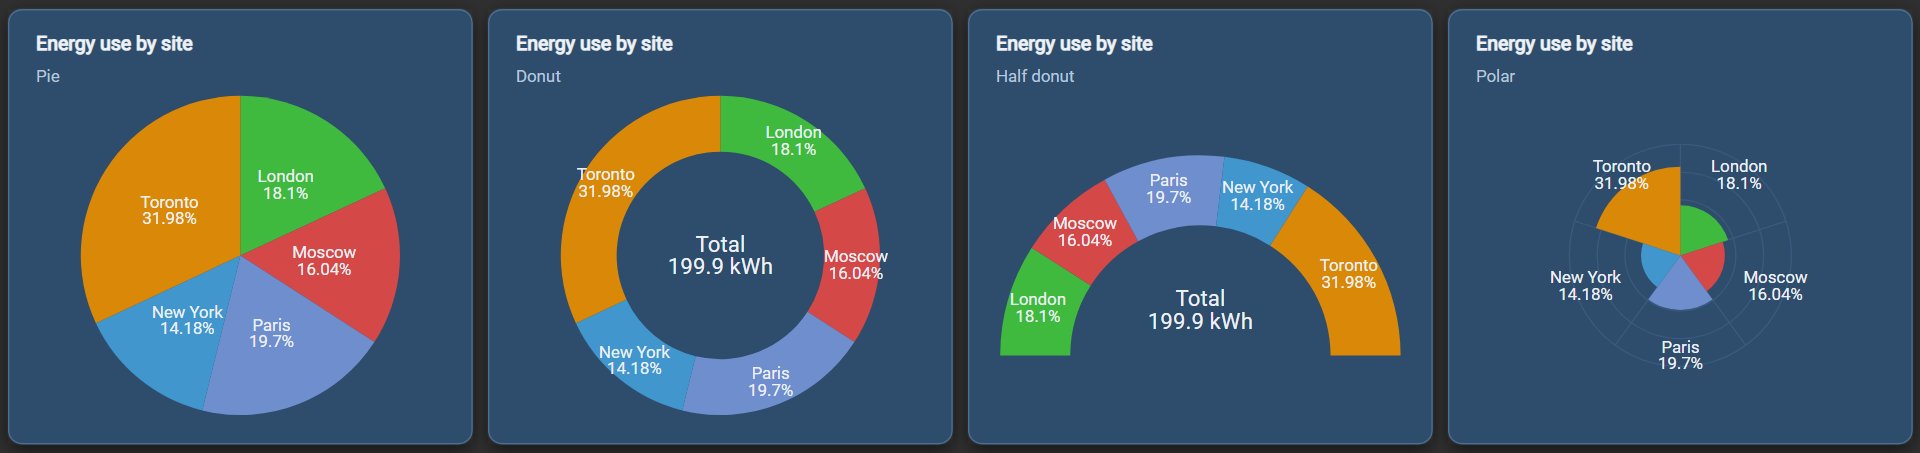
The same five sites shown four times in PI Vision: as a pie, as a donut with the total of 199.9 kWh in the centre, as a half donut with the total, and as a polar chart, each slice labelled with the site name and its percentage
The same five data sources as pie, donut, half donut and polar chart. Demo data. Select the image to enlarge.

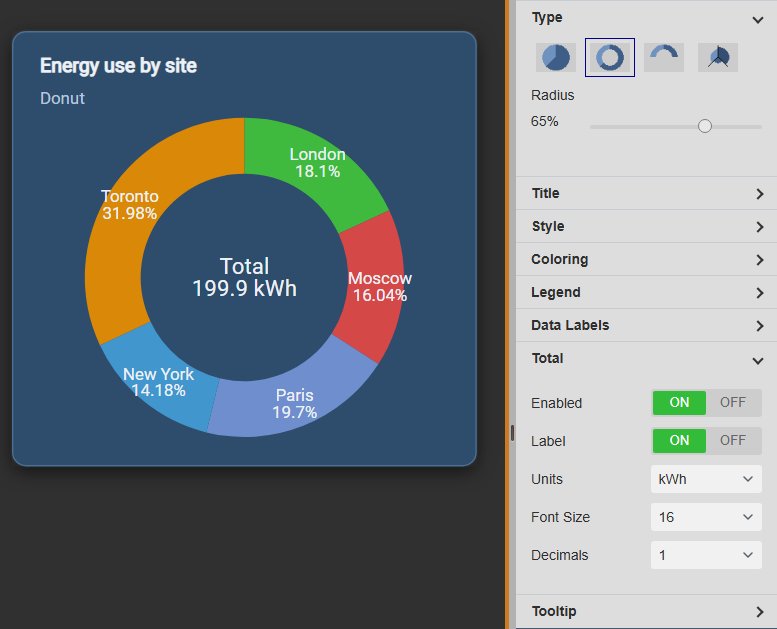
The total in the centre of the donut

Show the sum of all slices in the middle of a donut or half donut, so the total and its parts sit in one symbol.

  • Optional “Total” label above the sum.
  • Units and number of decimals for the total.
  • Its own font size.
  • Inner radius from a slider to give the total more room.
Pie Chart+ donut with the total of 199.9 kWh in the centre and percentage labels on the slices, next to the Type settings with a 65 percent radius and the Total settings with label, units kWh, font size 16 and one decimal
Donut with the total in the centre, next to the Type and Total settings. Demo data. Select the image to enlarge.

Pie chart labels, legend and tooltips in PI Vision

Decide how much each slice tells the reader: just its share, or its name, value and percentage, on the slice, in the legend or on hover.

Data labels and legend with names, values and percentages

Put the numbers where operators look: on the slices, in the legend, or both.

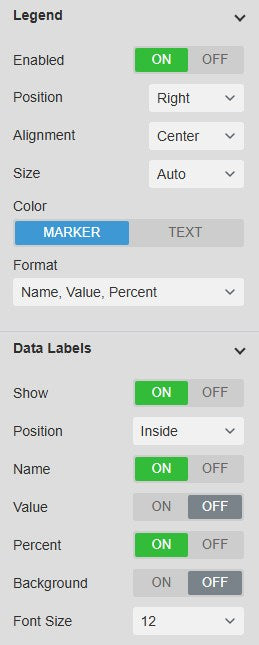
  • Labels with any mix of name, value and percent, inside or outside the slices.
  • Optional label background and font size.
  • Legend at the top, right, bottom or left, with alignment and width.
  • Legend text as name, value, percent or a combination.
Pie Chart+ Legend settings with position right, alignment center, automatic size, marker colour and the format Name, Value, Percent, and Data Labels settings with inside position, name and percent on, value and background off and font size 12
Legend and Data Labels settings. Select the image to enlarge.

Tooltips with value and share

Hover over a slice to read its exact value with units and its share of the total, while the other slices fade back.

  • Name, value with units and percentage in one line.
  • The hovered slice is highlighted.
  • Zero-value slices are never labelled, so labels stay readable.
  • Switch the tooltip on or off per symbol.
Pie Chart+ donut with the Toronto slice highlighted and the other slices faded, and a tooltip reading Toronto: 63.927 kWh (31.98%)
Tooltip on one slice of the donut. Demo data. Select the image to enlarge.

Pie chart data, colours and themes

Choose what each slice measures, and make the chart fit the rest of the display.

Current values or statistics over the display time range

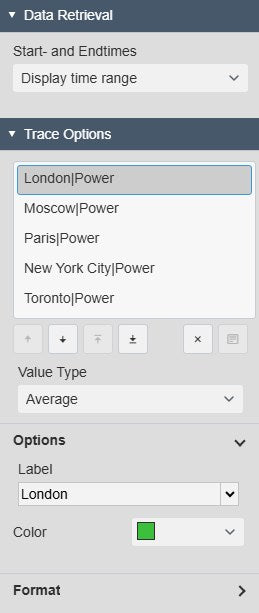
Show each slice as its current value, or as a statistic over the display time range, set per data source.

  • Value, average, minimum, maximum, range or standard deviation.
  • Label from the attribute, element, full path or your own text.
  • A colour per slice.
  • Number format per data source: database, general, number or scientific.
Pie Chart+ Data Retrieval and Trace Options with five city power attributes, the value type Average selected for London, and the Options with the label London and a green colour
Trace Options with the value type, label and colour of one data source. Select the image to enlarge.

Themes, containers and colours

Match the chart to the display with a built-in theme, or set the colours yourself.

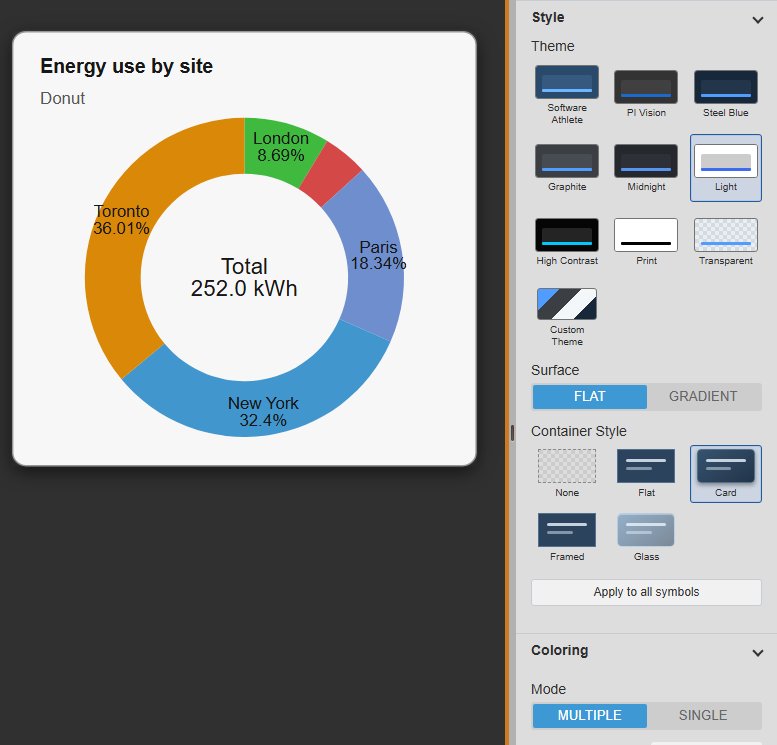
  • Nine built-in themes, including Light, Print and High Contrast, plus custom colours.
  • Flat or gradient surface, and a None, Flat, Card, Framed or Glass container.
  • Multiple colours or a single colour, with stroke and opacity.
  • Apply the style to every Vision Library+ symbol on the display in one step.
Pie Chart+ donut in the Light theme with a card container on a dark PI Vision display, next to the Style settings with the theme grid, surface and container style, and the Coloring settings with multiple colours, stroke and opacity
Light theme with a card container, next to the Style and Coloring settings. Demo data. Select the image to enlarge.

PI Vision pie chart examples

Four common ways teams use Pie Chart+ on their displays.

Energy use by area

Data
Energy or power meters per plant area or site
Settings
Donut with the total in the centre, labels with name and value
Shows
How the total splits across areas and which one uses most

Production by line

Data
Output or rate per production line
Settings
Pie with percent labels and a legend with values
Shows
Each line’s share of plant output at the display time

Load sharing

Data
Load or flow of parallel pumps, compressors or turbines
Settings
Value type Average over the display time range
Shows
Whether the load was shared evenly over the shift

Compact KPI tile

Data
Two or three parts of one total, such as feed streams
Settings
Half donut with the total, legend off, small symbol
Shows
The mix of a total in little space next to other KPIs

Pie Chart+ FAQ

Questions we are asked most often. Read the Pie Chart+ documentation or ask a technical question.

When should I use a pie chart instead of a bar chart in PI Vision?

Use Pie Chart+ when the question is how a total splits into a few parts, for example energy use by area. When exact comparisons or many categories matter more than the share of a whole, a bar chart is easier to read.

Can Pie Chart+ show the total in the middle?

Yes. Choose the Donut or Half Donut layout and switch on Total. The symbol adds up all slices and shows the sum in the centre, with an optional label, units, font size and decimals.

Can a slice show an average instead of the current value?

Yes. Each data source has a value type: Value for the value at the display time, or Average, Minimum, Maximum, Range or standard deviation over the display time range.

Do the data sources need the same unit?

They should. Percentages are calculated from the values themselves, so use data sources with compatible units that are parts of the same total, for example kWh from several meters.

What do we need to run it?

PI Vision 2021 or later with PI Web API, and PI AF Server 2018 SP2 or later. Pie Chart+ runs in PI Vision and uses each user’s existing PI permissions.

How do we get Pie Chart+?

Pie Chart+ is part of Vision Library+, together with the other Vision Library+ symbols. Request a trial to test it in your own PI Vision environment.

Try Pie Chart+ in your PI Vision

Pie Chart+ is included in Vision Library+, the PI Vision custom symbol library from Software Athlete. Test it on your own displays and data.