


PI Vision Custom Symbol
Visualize the Story Behind Your Data
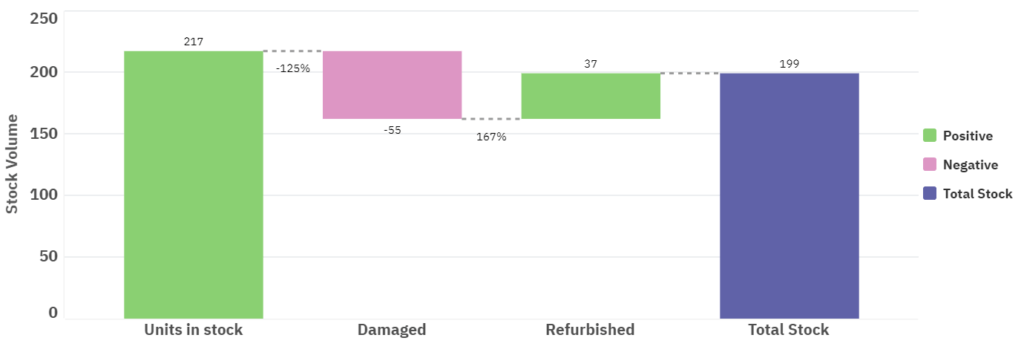
Understand the cumulative impact of positive and negative changes at a glance. Waterfall Chart+ visualizes the step-by-step journey of your metrics, from start to finish.
Pinpoint Key Drivers of Change
Storytelling with Data
- Visualize Cumulative Impact: Clearly see how a starting value is affected by a series of intermediate positive and negative contributions.
- Positive & Negative Contributions: Automatically color-code increases and decreases to show gains and losses.
- Clear Start & End Totals: Bookend your chart with total columns to provide a complete picture of the net change.
Powerful Analysis
- Root Cause Identification: Instantly spot the biggest drivers of change in your process or business metrics.
- Track Key Metrics: Perfectly suited for visualizing OEE losses, inventory changes, or financial statements.
- Time-Based Analysis: Analyze changes over a specific period, from a single shift to a full fiscal year.
Total Customization
- Custom Colors & Labels: Define colors for up, down, and total bars, and customize data labels for clarity.
- Connector Line Styling: Adjust the style of the lines connecting the bars to match your dashboard's design.
- Seamless PI Vision Integration: Works directly with your AF Attributes and PI Points with no-code configuration.
From Finance to the Factory Floor
OEE & Performance Breakdown
Visualize the Six Big Losses (breakdowns, setup, etc.) to see exactly what is impacting your equipment effectiveness.
Inventory & Material Balance
Track a starting inventory, then visualize additions, shipments, and shrinkage to arrive at the final on-hand amount.
Financial Reconciliation
Visualize a P&L statement, showing how starting revenue is affected by costs to arrive at net profit.
Energy Balance
Track energy from its source, showing consumption by different units and identifying major areas of energy loss.
Visualize the Complete Story

Track Equipment Effectiveness (OEE)
Visualize how availability, performance, and quality losses impact your overall equipment effectiveness.
Analyze Inventory Changes
Start with an opening balance, then track inflows, outflows, and adjustments to see the final inventory level.
See Waterfall Chart+ in Action

Questions?
Click the button below to get in contact, or simply email us at contact@software-athlete.com. We would love to help you.


