


Comprehensive Collection of PI Vision Custom Symbols
Vision Library+ is a comprehensive collection of custom symbols and widget extensions for AVEVA PI Vision, designed to elevate your dashboards with over 30 high-quality, customizable components.


Most Popular PI Vision Widgets


Manual Data Entry
With Vision Library+, manual data entry in PI Vision is finally solved. We have different custom controls for every one of your use-cases. From changing or updating archived data, to quickly adjusting values in the PI System, our controls support it all.

Manual Data Entry
Enables users to input data directly into the PI System via PI Vision dashboards. This widget supports real-time data updates, facilitating manual logging of readings or observations.

Manual Input Table
Provides a structured table format for entering multiple data points simultaneously. Ideal for batch data entry tasks, such as shift logs or inspection records

Quick Input
Offers a streamlined interface for rapid data entry, reducing the time required to input routine information. Enhances efficiency in environments with frequent manual data updates.
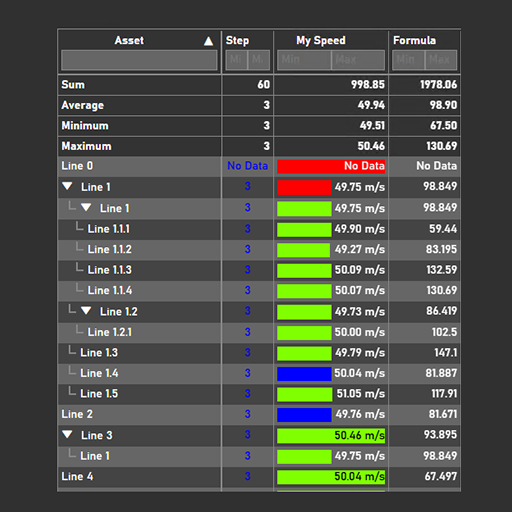
Asset Comparison Table
Compare asset relative data in a highly configurable table. Filter, search, group, export, child assets and more!
Advanced Charts
Vision Library+ includes a variety of different chart symbols, that add long-awaited features to PI Vision.

Combo Chart
A versatile charting tool that combines bar, line, scatter, and area charts into a single, interactive visualization. Ideal for comparing multiple data series and identifying trends within AVEVA PI Vision dashboards.

Heatmap
Displays data intensity through color gradients, making it easier to spot patterns, correlations, and anomalies in large datasets. Particularly effective for monitoring equipment performance and environmental conditions.

Pie / Polar Chart
Depicts proportional data in a circular format, allowing for quick assessment of component contributions to a whole. Suitable for visualizing categorical data such as downtime reasons or production losses.

Histogram
Illustrates the frequency distribution of data points, aiding in the analysis of process behavior and variability. Essential for statistical process control and quality assurance tasks.

Linear Gauge
Presents data on a linear scale with indicators for current values, targets, and thresholds. Useful for monitoring variables like temperature, pressure, or flow rates

Waterfall Chart
Demonstrates the cumulative effect of sequential positive and negative values, useful for understanding financial metrics, energy consumption, or production output changes over time.

Box Plot
Provides a statistical representation of data distribution, highlighting medians, quartiles, and outliers. Useful for quality control and process variability analysis in manufacturing environments

Asset Comparison Bar Chart
Facilitates side-by-side comparison of key performance indicators across different assets. This widget enables quick identification of performance disparities, aiding in asset optimization strategies.

Sankey Diagram
Illustrates flow quantities between nodes, making it ideal for energy balance analysis, material flow tracking, and identifying process inefficiencies.

Radar Chart
Unlock powerful process insights with Radar Chart+, a custom symbol for AVEVA PI Vision that displays multiple process variables in a single polar chart.

Radial Gauge
The Radial Gauge+ is an advanced gauge visualization, that allows displaying mulstistate ranges as well as multiple data points on a single scale.
Event Frame Management
Our customized widgets make it easier than ever to manage and visualize your event frames. Add, update or delete event frames with Events Table, or simply visualize them with the Gantt Chart. Click here to learn more about advanced event frame management in PI Vision.

Events Table
Add, update or delete event frames with Events Table+. Allows you to update static event frame attributes with interactive controls like dropdown menus or checkboxes.

Gantt Chart
Visualizes project timelines and event frames, allowing for efficient scheduling and tracking of tasks. Features drag-and-drop functionality and color-coding for enhanced project management.
Enhanced Usability
Our other controls add a lot of missing features to PI Vision. From collapsible navigation menus, to sounds and tables for SQL data.

Navigation Menu
Create an expandable web-like Navigation Menu for your displays. Synchronize across displays, so you only need to manage one link menu for all your displays.

Asset Select
Select your assets from a fully configurable asset view, that supports tree or list views, multistate and more.

Alarm Sound
Play sounds in PI Vision when certain value thresholds are reached. Notify your operators immediately and react accordingly.

AF Table
Integrates with Asset Framework to present hierarchical asset data, enabling users to navigate complex structures and view associated attributes seamlessly.

Ad-hoc Value
An improved version of the PI Vision default Value symbol, that allows you to create a draggable ad-hoc chart window when hovering over the value.

DateTime Picker
Create stunning PI Vision Dashboards with our interactive DateTime Picker Control. No more struggling with the PI Vision Time Bar - simply and easy to use.

Web View
Display web sites and other displays in PI Vision. Create slideshows and ad-hoc windows.

Time Series Table
Displays time-stamped data in a tabular format, allowing users to analyze trends and patterns over specific periods. Supports sorting and filtering for focused data examination.

PI Vision Native vs Vision Library+
See how native PI Vision Dashboards compare to advanced and modern Dashboards using Vision Library+ Custom Symbols.


Choose the Vision Suite that fits your needs
Unlock the full potential of your PI Vision system with our all-in-one suites. Each package bundles our powerful add-ons at a significant discount, providing a comprehensive and seamlessly integrated solution.
Vision Library+
Includes our complete Vision Library+.
Best for enhancing PI Vision dashboards.
- ✔️ Data entry symbols
- ✔️ Advanced visualizations and charts
- ✔️ Event Frame management
- ✔️ Improved UX/UI Controls
- ✔️ Seamless PI Vision integration
Vision Suite Essential
Includes Vision Library+ and Vision Report+.
Best for teams needing enhanced dashboards & automated reporting.
- ✔️ Everything in Vision Library+
- ✔️ Vision Report+ for automated reporting
- ✔️ Generate PDF and Excel reports directly from PI Vision
- ✔️ Print any display easily
Vision Suite Ultimate
Includes Library+, Report+, and Audit+.
Best for regulated industries needing compliance.
- ✔️ Everything in Vision Suite Essential
- ✔️ Vision Audit+ for full display versioning
- ✔️ Restore deleted displays and view edit history
- ✔️ Generate validation and audit reports automatically
- ✔️ Validate PI Vision displays for GxP and regulated environments
Frequently Asked Questions
Can I trial Vision Library+?
Sure! Simply create an account on our website and download a 30-day trial version here.
How does licensing work?
Vision Library+ is a 12-month subscription based service, with ever expanding features and symbols.
Where can I find information on pricing?
Get in contact with our sales team to get more information on pricing.
Can I purchase individual symbols?
Unfortunately not, all our symbols are packaged together in the Vision Library+. You can however decide on our own which ones to install.

Questions?
Drop us a message using the form below, and our team will get back to you within 24 hours.


