Linear Gauge+ for AVEVA PI Vision

PI Vision linear gauge with the operating ranges built in

Show where a value sits in its operating range at a glance. Linear Gauge+ places one or more PI points or AF attributes on a horizontal or vertical scale in your PI Vision display, as markers or bars, with the multi-state ranges drawn alongside.

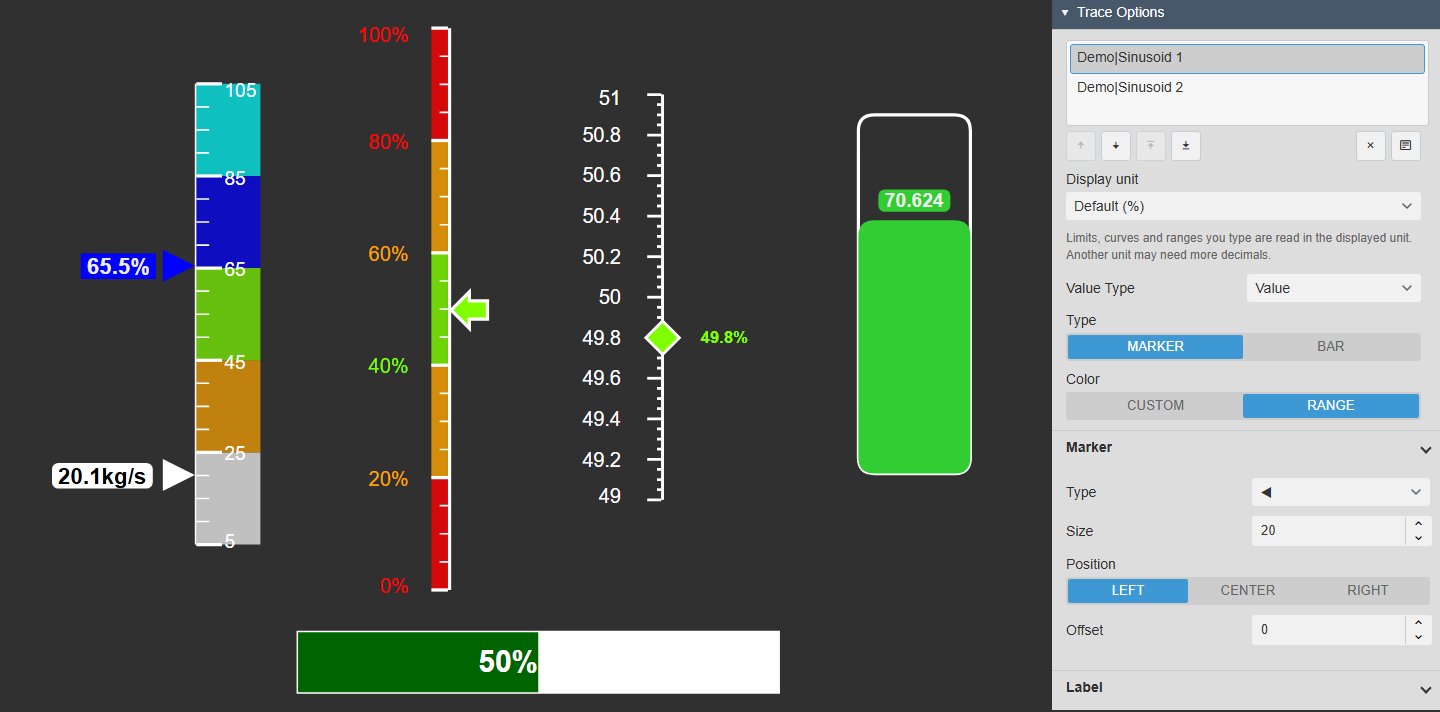
Five Linear Gauge+ symbols in PI Vision: a vertical gauge with two range-coloured markers and value labels on a multi-state range bar, a gauge with red, amber and green ranges and an arrow marker, a fine scale with a diamond marker, a bar in a rounded container and a horizontal bar, next to the Trace Options settings with the data source list, display unit, value type, type, colour and marker settings
Linear Gauge+ v2.0 in PI Vision: five gauge configurations next to the Trace Options settings. Demo data. Select the image to enlarge.

PI Vision linear gauge for one or several values

Put one value or a group of related values on a single scale, and choose for each how it is drawn and what it shows.

Several values on one shared scale

Compare related values in a compact gauge instead of placing several symbols side by side.

  • Add several PI points or AF attributes to one gauge.
  • Each data source has its own marker or bar, colour and label.
  • Marker offsets and label positions keep values that lie close together readable.
  • Best with data sources that share units and a similar range.
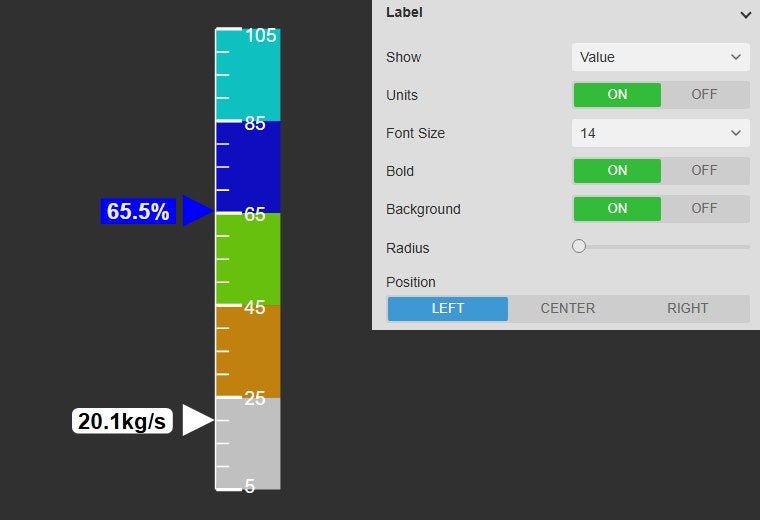
Linear Gauge+ with two data sources as range-coloured markers on one vertical scale with five multi-state ranges, each with a value label on a background, next to the Label settings with Show, Units, Font Size, Bold, Background, Radius and Position
Two values on one scale, each marker in the colour of its current range, next to the Label settings. Demo data. Select the image to enlarge.

Markers or bars, with a bar container

Show a value as a marker at its position on the scale, or as a bar filled from the scale minimum, for levels and loads.

  • Five marker shapes, with size, side of the scale line and offset.
  • Bar width per data source, in a custom colour or the colour of its range.
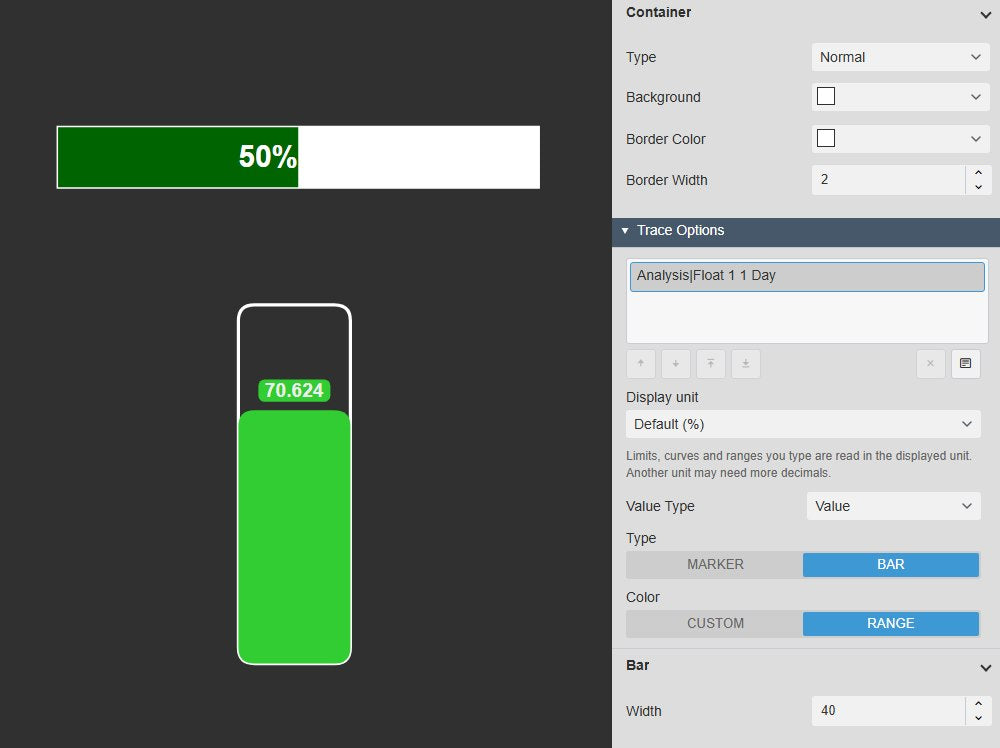
  • An optional container behind the bars: Normal, Rounded or Thermometer.
  • Container background, border colour and border width.
Two Linear Gauge+ bars in PI Vision, a horizontal bar in a Normal container and a vertical bar in a Rounded container with a value label, next to the Container settings and the Trace Options with the type set to Bar and the bar width
Bars in a Normal and a Rounded container, next to the Container and bar settings. Demo data. Select the image to enlarge.

Current value or a summary over the time range

Show the latest value, or a summary of each data source over the display time range or a time range of its own.

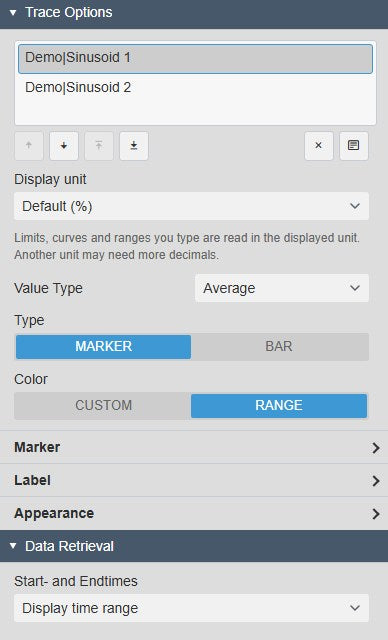
  • Value type per data source: current value, average, minimum or maximum.
  • Also standard deviation, population standard deviation and range.
  • Start- and Endtimes from the display, a custom time range, or a duration and offset.
  • A display unit of your choice for AF attributes with a unit of measure.
Linear Gauge+ Trace Options with two data sources, the display unit, the value type set to Average, the type Marker and the colour Range, above the Data Retrieval setting Start- and Endtimes
The value type of one data source set to Average, and the time range under Data Retrieval. Select the image to enlarge.

Linear gauge with multi-state operating ranges

Draw the normal, warning and alarm ranges from your PI Vision multi-state rules along the scale, so the operating state is visible without reading the number.

A range bar from your multi-state rules

The range bar uses the colours and limits of the multi-state rules you already configure in PI Vision. Change a limit there and the gauge follows.

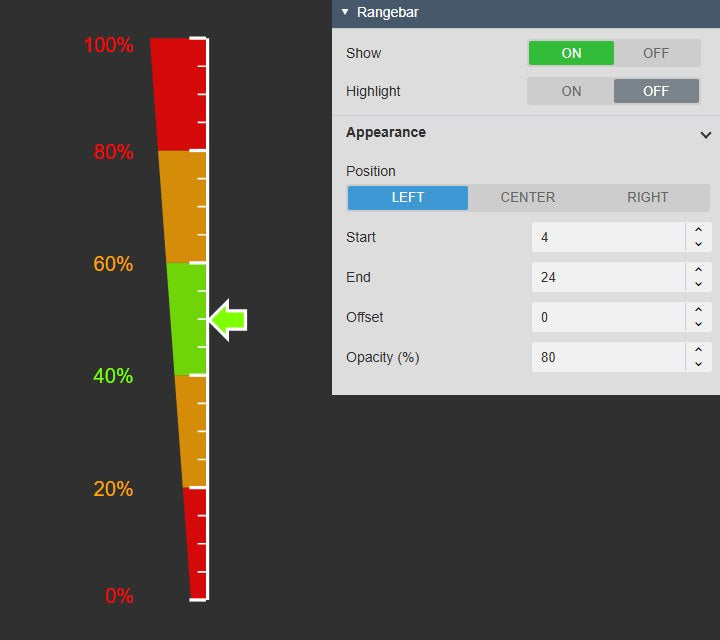
  • Range bar to the left, centre or right of the scale line.
  • Start and end width for an even or a tapered bar.
  • Offset from the scale line and opacity in per cent.
  • A blended colour gradient between the ranges on horizontal gauges.
Linear Gauge+ with a tapered multi-state range bar in red, amber and green beside a vertical scale, range-coloured scale labels and an arrow marker in the green range, next to the Rangebar settings with position Left, start width 4, end width 24, offset and opacity
A tapered range bar from the multi-state rules, next to the Rangebar settings. Demo data. Select the image to enlarge.

Highlight the active range, ticks at the limits

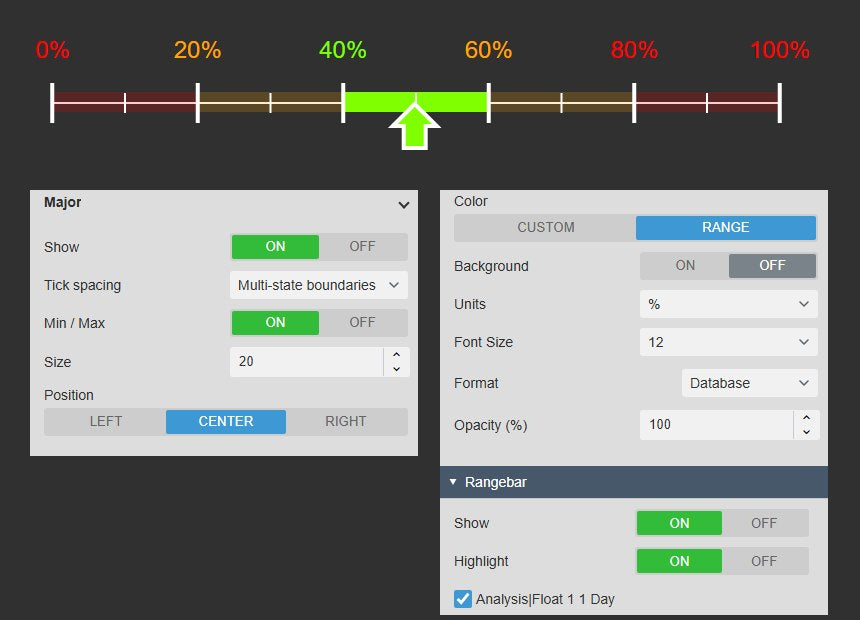
Emphasise the range the value is in and dim the others, and put the scale ticks exactly on the range limits.

  • Highlight follows the data source you select.
  • Markers, bars and scale labels can take the colour of the current range.
  • Tick spacing Automatic, Fixed interval or Multi-state boundaries, with the scale minimum and maximum.
  • Major and minor ticks with their own size and position.
Horizontal Linear Gauge+ with the active green range at full colour and the amber and red ranges dimmed, ticks and range-coloured scale labels at the multi-state limits, above the Major tick settings with Tick spacing Multi-state boundaries and the Labels and Rangebar settings with Color Range and Highlight on for the data source
The active range highlighted, with ticks and coloured labels at the multi-state limits. Demo data. Select the image to enlarge.

Linear gauge layout, labels and data quality

Fit the gauge to the space on the display, label it the way operators read it, and flag values that have stopped updating.

Horizontal or vertical, styled like the display

Use a tall gauge for levels and temperatures or a flat one for a row of values, and match its look to the rest of the display.

  • Vertical or horizontal orientation, scale on either side, inverted scale.
  • Automatic range, or a custom minimum and maximum.
  • Built-in themes such as PI Vision, Light and Print, or custom colours and font, with a flat or gradient surface and a container style.
  • An optional title.
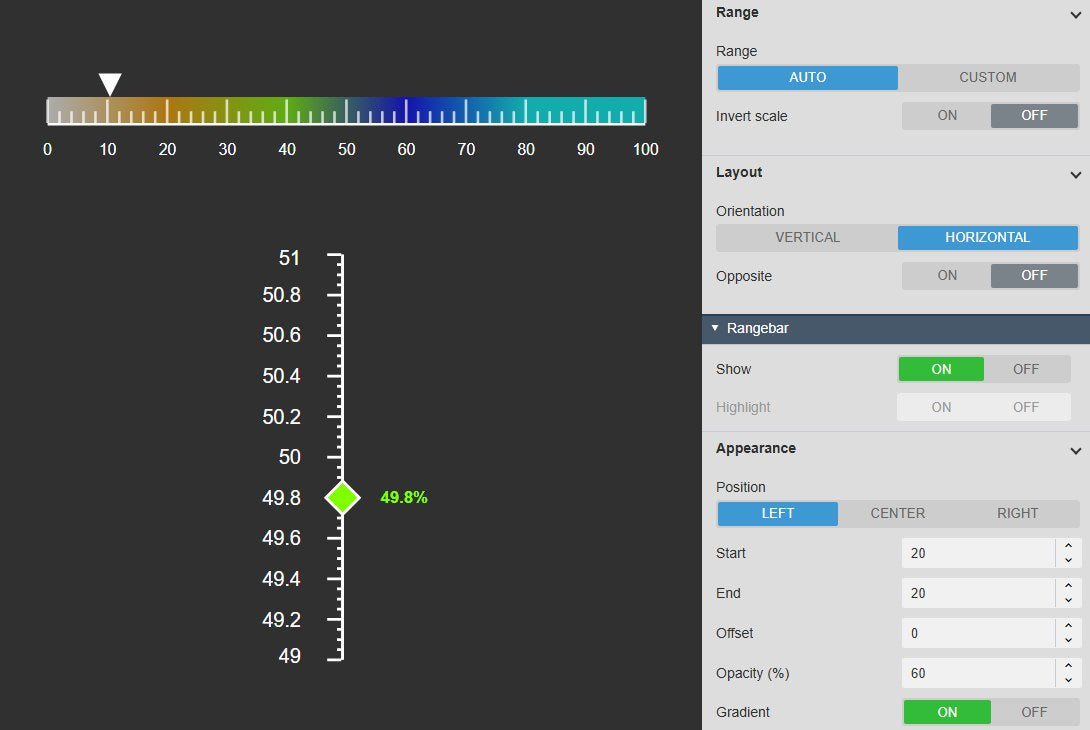
A horizontal Linear Gauge+ with a blended gradient range bar and a triangle marker, and a vertical gauge with a diamond marker on an automatic range, next to the Range and Layout settings with orientation Horizontal and the Rangebar settings with Gradient on
A horizontal gauge with a gradient range bar and a vertical gauge, next to the Range, Layout and Rangebar settings. Demo data. Select the image to enlarge.

Value labels, tooltips and a stale warning

Read the number next to each marker or bar, and see when a value has stopped updating.

  • Label per data source: value, name, or name and value, with units.
  • Font size, bold, a background with rounded corners and the label position.
  • Hover tooltip with the value and units, optionally with the data source name.
  • An amber clock when a value is older than the stale limit; its tooltip names the data source, the last event and the data age.
A horizontal Linear Gauge+ bar with the amber stale clock above it, next to the Data Quality settings with Stale warning on and Stale after 2 hours
The stale clock on a gauge whose data source has not updated for longer than the limit. Demo data. Select the image to enlarge.

PI Vision linear gauge examples

Four common ways teams use Linear Gauge+ on their displays.

Bearing temperature against its limits

Data
Bearing temperature of one pump with normal, warning and alarm limits
Settings
One marker, multi-state range bar with Highlight, ticks at the multi-state boundaries
Shows
The current value and which operating range it is in

Tank and silo levels

Data
Level of each tank in per cent
Settings
Vertical gauges, one bar each in a Rounded container, value label with units
Shows
How full each tank is, readable at a glance

Related temperatures on one scale

Data
Inlet and outlet temperature of a heat exchanger
Settings
Two markers with different offsets, name and value labels, custom range
Shows
Both values and the gap between them in one compact gauge

Line speed over the shift

Data
Speed of a production line with its target band
Settings
Horizontal gauge, value type Average over the display time range, gradient range bar
Shows
Whether the line ran inside its band on average

Linear Gauge+ FAQ

Questions we are asked most often. Read the Linear Gauge+ documentation or ask a technical question.

When should I use Linear Gauge+ rather than Radial Gauge+ or the PI Vision gauge?

Use a gauge for the current state and a trend when operators need to see how a value changed over time. Choose Linear Gauge+ for a compact horizontal or vertical layout, for several related values on one shared scale, or for levels shown as bars. Radial Gauge+ is the better fit when a circular dial with a needle and a centre value suits the display. PI Vision’s own gauge remains a good choice for a simple single value; Linear Gauge+ adds markers and bars on one scale, a multi-state range bar with the active range highlighted, summary values over a time range, the stale warning and the Vision Library+ themes.

How do the operating ranges get onto the gauge?

The range bar uses the colours and limits from the PI Vision multi-state rules on a data source, so you edit the range values in the multi-state configuration, not in the gauge. The range bar settings appear once multi-state is enabled for at least one data source. Highlight and the colour gradient cannot be on at the same time, and the gradient is available on horizontal gauges.

Can several values share one gauge?

Yes. Add several data sources and give each its own marker or bar, colour and label. Use data sources with compatible units and ranges, set a custom minimum and maximum that includes every expected value, and use different marker offsets or label positions when values lie close together.

Does the gauge show the current value or an average?

Each data source can show its current value or a summary such as the average, minimum, maximum or range. Summaries are calculated over the display time range, or over the time range set under Data Retrieval. If a summary looks unexpected, check the selected value type and the active time range.

What do we need to run it?

PI Vision 2021 or later with PI Web API, and PI AF Server 2018 SP2 or later. Linear Gauge+ runs in PI Vision and uses each user’s existing PI permissions.

How do we get Linear Gauge+?

Linear Gauge+ is part of Vision Library+, together with the other Vision Library+ symbols. Request a trial to test it in your own PI Vision environment.

Try Linear Gauge+ in your PI Vision

Linear Gauge+ is included in Vision Library+, the PI Vision custom symbol library from Software Athlete. Test it on your own displays and data.