Software Athlete
Radar Chart+
Shipping & Returns
Row content
Compatibility
Row content

Radar Chart+
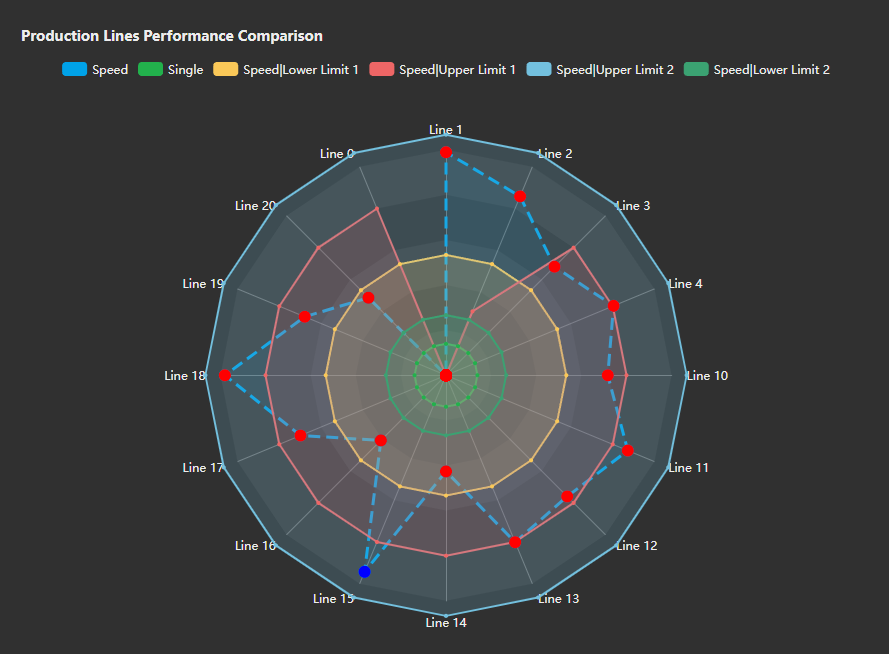
PI Vision Radar Chart Control
Radar Chart+ is a highly configurable custom symbol for AVEVA PI Vision that visualizes multiple process values across units or assets using a polar (spider) chart. Ideal for comparing equipment performance or highlighting anomalies, Radar Chart+ supports dynamic data labels, multistating, and auto-generated axes based on asset search criteria. It is part of the Vision Library+ Symbol Package.
Features
- Multi-Attribute Visualization: Display multiple KPIs (e.g., speed, pressure) on a single radar chart for fast comparison.
- Asset Search Integration: Automatically populate chart axes using AF search criteria or PI Vision context.
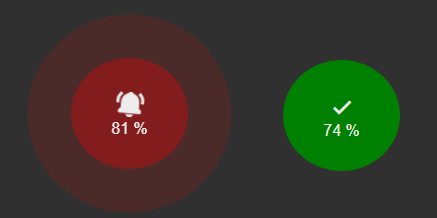
- Multistating: Apply PI Vision multistate rules to data points that exceed thresholds or limits.
- Custom Styles and Ranges: Configure axis scales, chart colors, background shades, and more.
- Dynamic Data Labels: Show current values directly on each spoke for fast visibility and diagnostics.
- Responsive Layout: Chart resizes intelligently based on display panel dimensions.
- Data Binding: Bind values using AF attributes, with support for expressions and filters.
- Interactive Behavior: Hover to inspect values or click for ad hoc trends and deeper analysis.
Benefits
- Fast Issue Detection: Instantly see deviations or underperforming units.
- Efficient Comparison: Evaluate equipment or process KPIs side by side across a standard scale.
- Smart Automation: Use AF asset search to eliminate manual configuration effort.
Example Use Cases
- Pump Stations: Compare head pressure, flow rate, power draw, and vibration across all pumps.
- Compressor Monitoring: Visualize speed, discharge pressure, temperature, and health scores.
- Plant Performance: Track multiple KPIs for different production lines or areas.
- Process Auditing: Quickly verify if equipment is operating within safe or optimal ranges.
- Control Room Dashboards: Use as a real-time visual fingerprint of operational status.
Screenshots


Radar Chart with Multistating
Visualize speed and pressure across multiple lines with out-of-limit values highlighted.

Data Labeling
Labels show exact values on each axis — no hovering required.

Asset Search
Automatically populate your radar chart with the dynamic asset search criteria feature

Supports multiple attributes
Compare multiple attributes (like speed, pressure, etc.) at the same time - for as many assets as you need

Wind Rose
Show wind direction and wind speed