



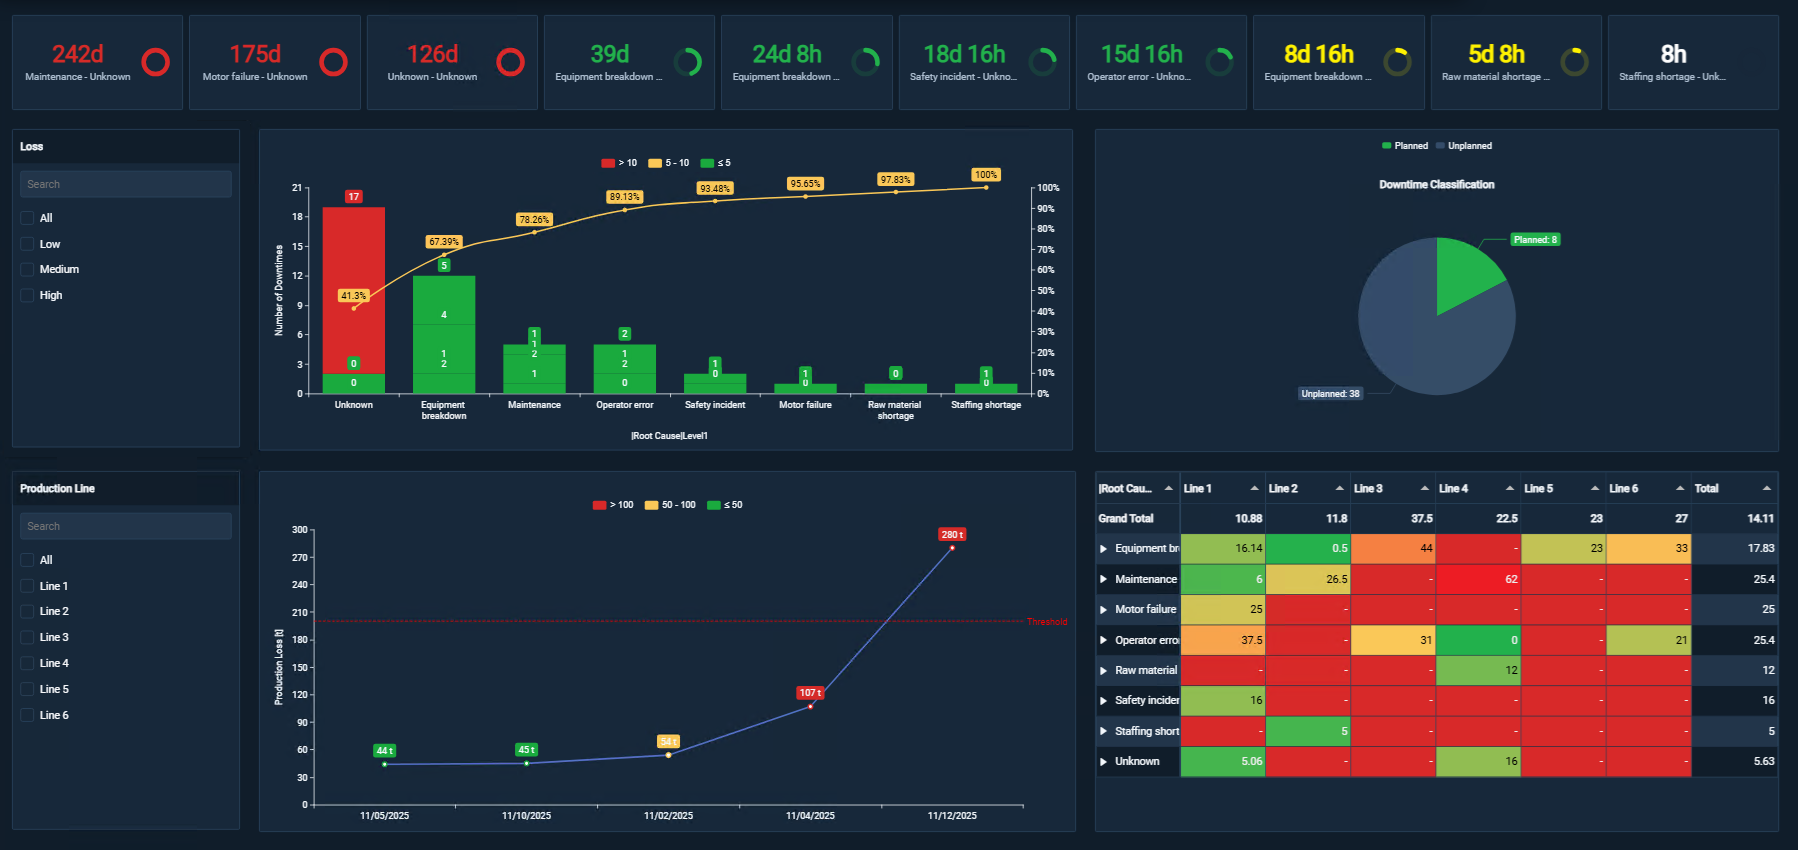
Chart symbols for PI Vision
Chart types the native symbol palette does not cover: combined trends and bars, distributions, heatmaps, flows and frequency analysis.
- Combo Chart+Line, bar, scatter and area series in one chart
- Period Comparison Chart+Today against yesterday, last week or last year
- Heatmap+Values by time and category as a color grid
- Box Plot+Distribution, variability and outliers
- Histogram+Frequency distribution of process values
- Pie Chart+Share of a total by category
- Waterfall Chart+What changed a value from start to end
- Sankey Diagram+Energy, material and cost flows
- ProfileView+Cross-direction scanner profiles as a heatmap
- FFT+Frequency spectrum for vibration analysis
- Duval Triangle+Transformer fault diagnosis from dissolved-gas data
- Control Chart+SPC control chart with rules, limits and Cpk/Ppk
- XY Plot+Scatter plots with regression lines, envelopes and time trails


