Software Athlete
Sankey
Shipping & Returns
Row content
Compatibility
Row content
PI Vision Custom Symbol
Interactive Sankey Diagrams for PI Vision
Instantly trace energy loss, material flows, and production costs. Sankey+ is a powerful custom symbol that visualizes complex flows between process stages with a clear, interactive diagram.
From Raw Data to Actionable Insight
Dynamic Flow Visualization
- Variable-Width Links: Automatically represent flow magnitude between source and destination nodes.
- Custom Node Configuration: Set node positions, groupings, and colors based on attributes or tags.
- Dynamic Data Labels: Show flow values, percentages, or custom expressions directly on the diagram.
Interactive Analysis
- Click-to-Trend: Configure click actions on any flow to open ad hoc trends for deeper investigation.
- Multistate Formatting: Apply PI Vision multistate rules to nodes and links to highlight thresholds or statuses.
- Responsive Layout: Diagrams automatically adjust to fit any display size with smart node spacing.
Total Customization
- Full Style Control: Customize colors, node shapes, link opacity, and text positioning.
- Flexible Data Binding: Bind data using AF elements and attributes, with optional calculations.
- No-Code Configuration: All features are managed through intuitive panels—no coding required.
Unlock Insights in Any Industry
Energy & Utilities
Visualize energy inputs, losses, and outputs in a plant or track water flow between treatment stages.
Oil & Gas Production
Track material flows between wells, separators, pipelines, and storage units to identify bottlenecks.
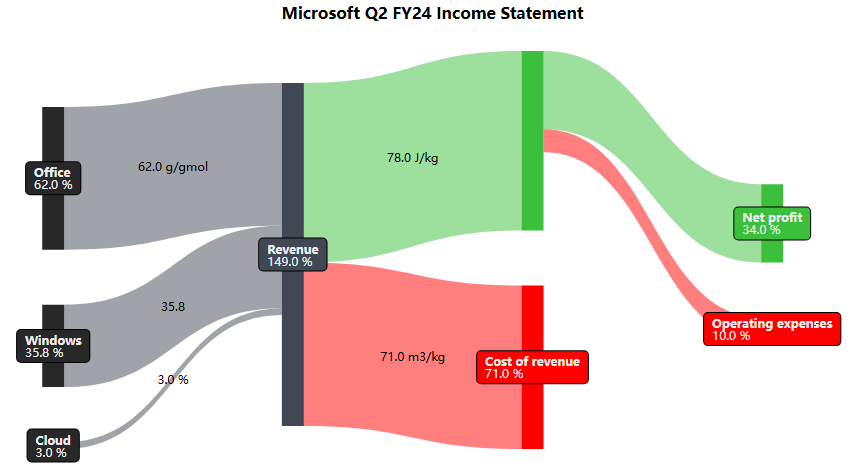
Finance & Costing
Create clear visualizations of how budgets, costs, and revenue flow through departments or projects.
Manufacturing
Trace how raw materials are transformed into intermediate and finished goods, step by step.
Fully Configurable, Beautifully Clear

Energy Flow Diagram
Visualize energy use, loss, and recovery across complex systems.

Oil & Gas Flows
Map material flow between process units to detect inefficiencies or leaks.

Node Customization
Configure nodes with custom colors, labels, positions, and multistate logic.

Click-to-Trend
Click on any flow to open ad hoc trends or navigate to detailed displays.