PI Vision Custom Symbol • Vision Library+
Uncover Hidden Machine Faults with the FFT Chart
Bring powerful spectrum analysis natively into AVEVA PI Vision. Transform high-frequency time-series data into the frequency domain to monitor rotating machinery, detect early-stage wear, and prevent catastrophic failures—all without leaving your dashboard.
Advanced Signal Processing Meets Intuitive Design
Powerful Signal Processing
- Dynamic FFT Engine: Calculate your data on the fly. Choose between Peak, RMS, Peak-to-Peak, and PSD spectrum outputs based on your monitoring standards.
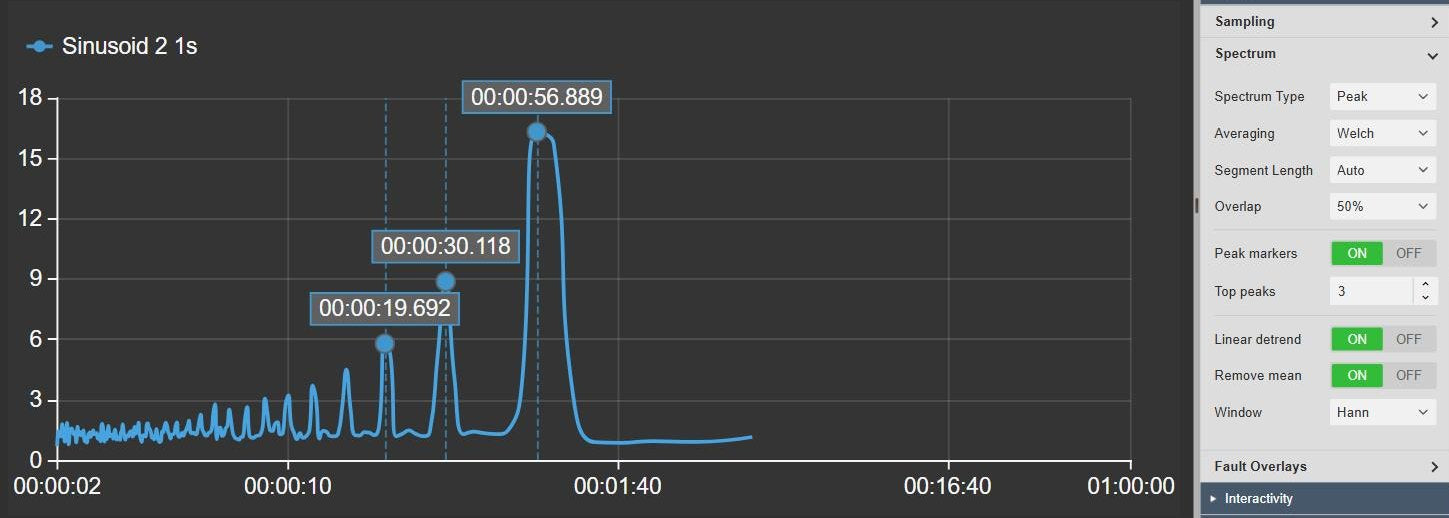
- Noise Reduction: Utilize Welch's averaging method with custom overlaps and segment lengths to filter out random background noise and reveal true mechanical frequencies.
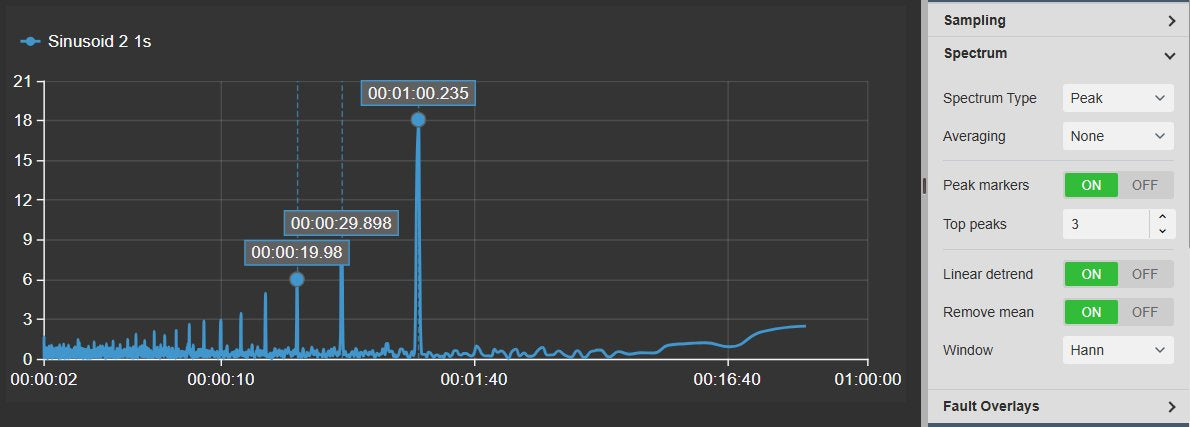
- Precision Adjustments: Apply linear detrending, mean removal (DC offset), and specialized windowing (Hann, Flat Top, Blackman-Harris) for crystal-clear signals.
Interactive Diagnostics
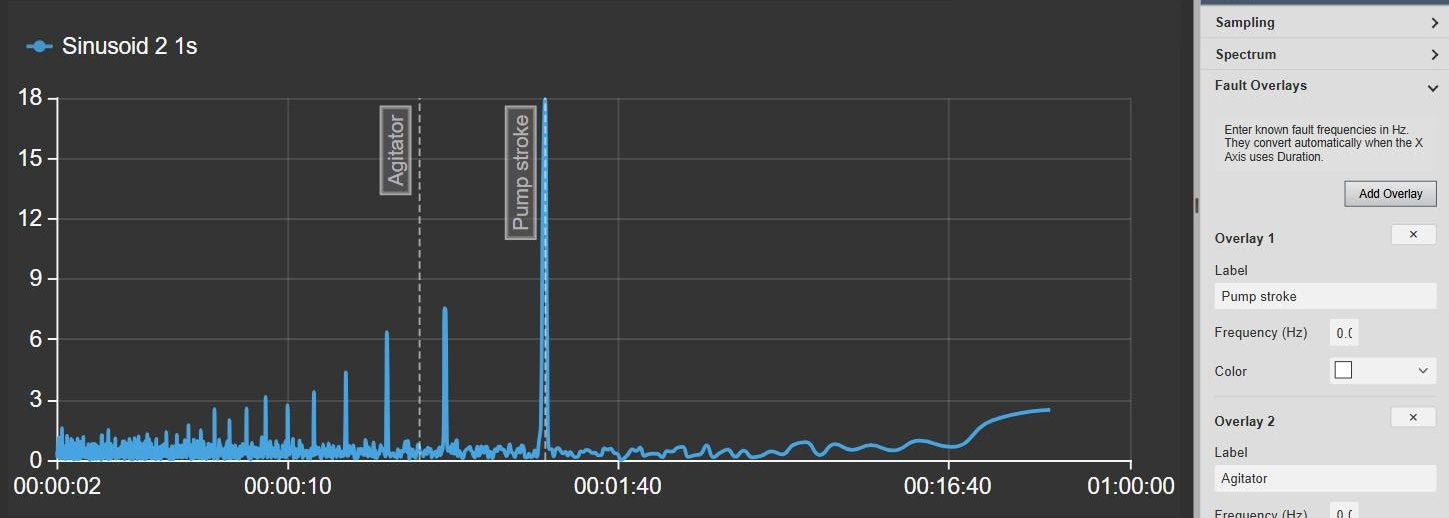
- Known Fault Overlays: Add custom vertical reference markers for known machine fault frequencies (e.g., BPFO, Gear Mesh) to instantly diagnose issues when peaks align.
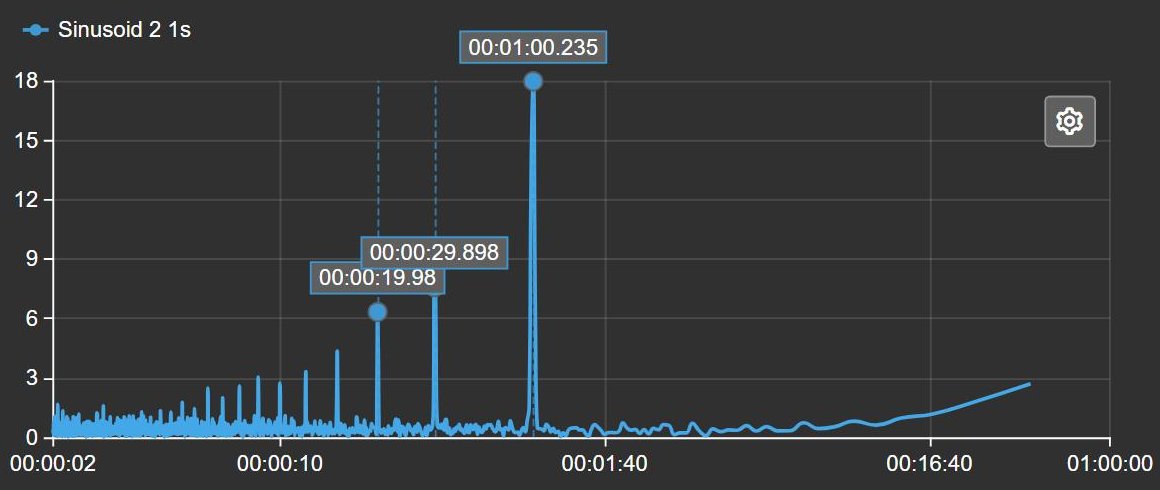
- Auto Peak Detection: Stop hunting for values with your mouse. Automatically highlight and label the top amplitude peaks directly on the chart.
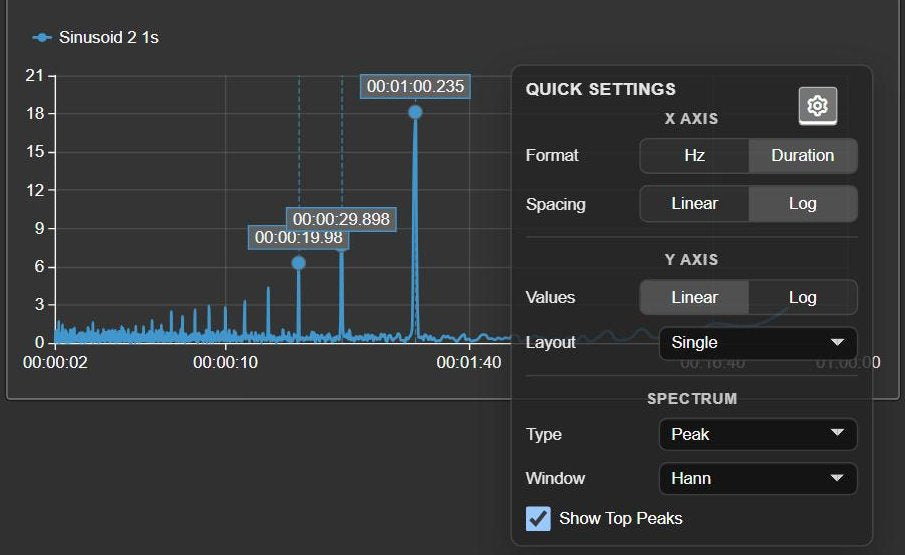
- Quick Settings Menu: Rapidly toggle between Linear/Log scales, Hz/Duration formats, or apply different calculation types on the fly without opening the configuration pane.
Advanced Visualizations
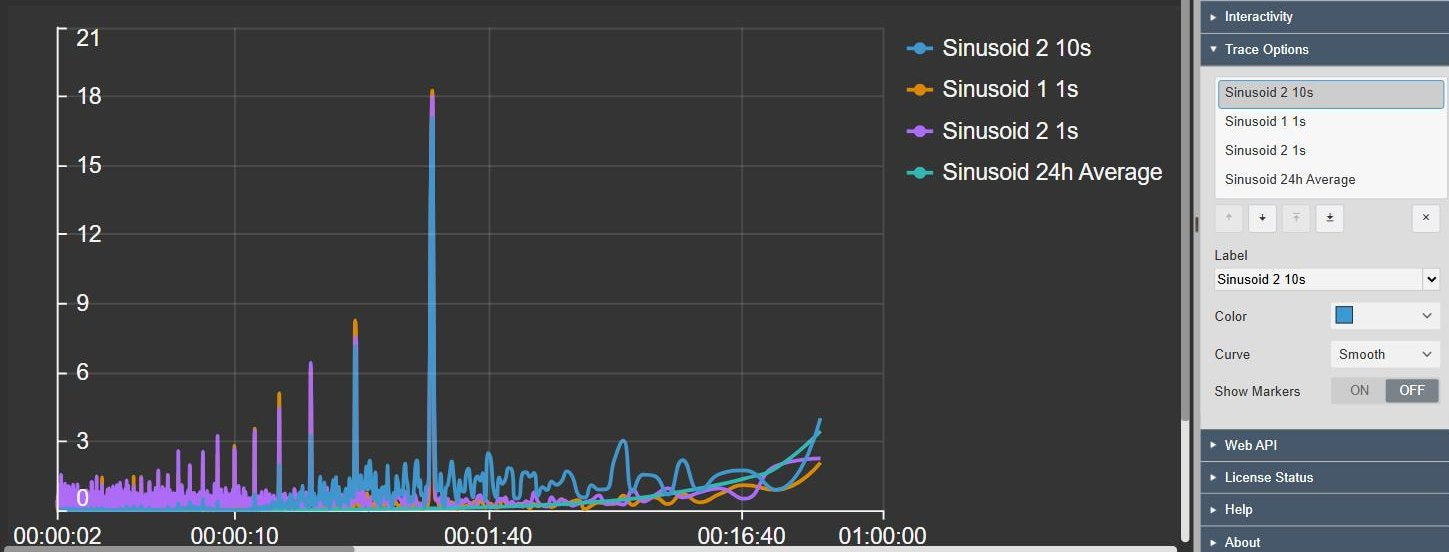
- Multi-Trace Layouts: Compare multiple sensors seamlessly. Choose between a single shared axis, multiple overlapping scales, or cleanly separated stacked lanes.
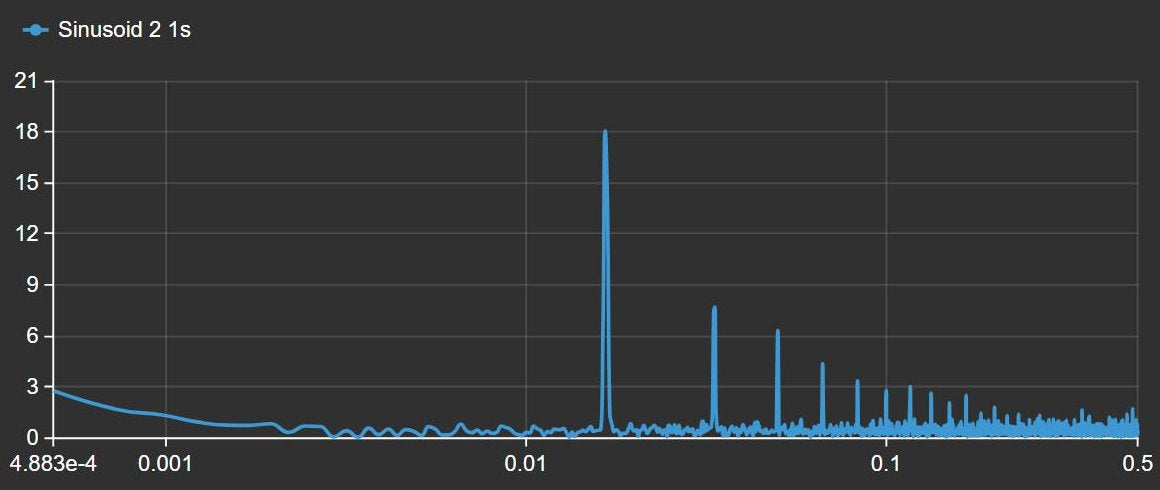
- Logarithmic & dB Scaling: Uncover hidden micro-vibrations (like early bearing wear) alongside massive dominant frequencies using Log spacing and Decibel (dB) scales.
- Total Customization: Adjust trace colors, line styles (smooth vs. stepped), background transparency, and layout formatting to match your operational dashboards perfectly.
From Raw Vibration to Actionable Intelligence
Rotating Equipment Monitoring
Detect imbalance, misalignment, and mechanical looseness in pumps, motors, and fans long before they trigger high-overall vibration alarms or cause unplanned downtime.
Early Bearing Defect Detection
Spot early-stage roller bearing wear by overlaying custom Fault Frequencies (like BPFO or BPFI) against your live data using Decibel (dB) scaling to highlight tiny harmonics.
Electrical Motor Faults
Differentiate between mechanical problems and electrical issues. Pinpoint rotor bar faults and slip frequencies in motor current signatures with high-resolution sampling.
Structural Resonance Analysis
Toggle the X-axis from Hz to 'Duration' to analyze slow-moving processes. Identify long-wave resonant frequencies in structures, piping, and large-scale industrial frames.
Condition Monitoring Built for the Web
Instant Fault Identification
Configure custom fault overlays for known frequencies like gear mesh or blade pass. When a live peak perfectly intersects your overlay line, you instantly know the root cause of the vibration.
Compare Multiple Sensors
Bring in data from inboard, outboard, radial, and axial sensors all at once. Use the 'Separate Scales' layout to neatly stack traces so smaller signals are never dwarfed by larger ones.
On-the-Fly Quick Settings
Don't lose your flow state. Click the gear icon on the chart to instantly switch between linear/logarithmic scales, change axis formats, or toggle peak markers without opening the config pane.
Cut Through the Noise
Enable Welch's Averaging to suppress random operational noise and clearly expose true mechanical spikes. Use Auto Peak Detection to tag the exact frequencies causing the disturbance.
See the FFT Chart in Action
Watch a quick demo showing how easy it is to perform native vibration analysis and setup fault diagnostics directly inside AVEVA PI Vision.
Questions?
Click the button below to get in contact, or simply email us at contact@software-athlete.com. We would love to help you.