PI Vision, favored by process manufacturers for its integration with OSIsoft’s/Aveva’s PI Server, is a prominent tool in process data visualization and analysis. Despite its widespread use and strengths in handling time-series data, PI Vision is not without its drawbacks and areas for improvement, as is the case with many software platforms.
AVEVA's PI Vision, a web-based tool, is essential for accessing and interacting with real-time and historical process data through various visual formats. As a long-standing participant in the time-series data industry, we have extensive experience in similar manufacturing settings and share a customer base with AVEVA. Our deep familiarity with the industry and end-users, gained from integrating our visualization tools with PI Server numerous times, informs our perspective.
With AVEVA transitioning from ProcessBook to PI Vision, reactions among users vary. This post aims to provide a deeper understanding of PI Vision, share user feedback, and explore potential solutions to many of the missing PI Vision features.
Why PI Vision instead of Processbook?
PI Vision is meant to be the successor of Processbook and offers many new features and improvements:
-
Scalability: PI Vision is more scalable than ProcessBook, effectively managing larger data sets which is crucial for expanding organizations.
-
Enhanced Visualization: Offers advanced visualization options, providing richer and more detailed data representations than ProcessBook.
-
Collaboration: PI Vision's collaborative features are superior, enabling users to share and work on data insights as a team, enhancing productivity.
-
Mobile Access: Unlike ProcessBook, PI Vision provides mobile access, allowing users to interact with data remotely, adding flexibility and convenience.
As you can see, PI Vision has many advantages over Processbook. Unfortunately, we still see a lot of customers struggling to make the switch, because they are not fully satisfied with PI Vision.
Why you might want to consider adding Custom Symbols to PI Vision
With AVEVA dropping support for Processbook in 2024, many process manufacturers are being forced to find alternative visualization tools.
PI Vision, the successor of Processbook, is one of those alternatives. It is also the logical choice for most companies. However, that solution does not provide all the features that most companies need. As a result, most companies are either looking for alternatives or trying the extend PI Vision's functionalities on their own.
However, extending PI Vision's features is not an easy task, and having your own team of developers can pose it's own risks.
Below are some common frustrations we’ve encountered when talking to customers and other PI Vision users. It is important to note that individual experiences may vary and some of these issues may be addressed by updates or workarounds.
No PI Manual Logger support
According to our customers, Manual Data Entry options are the most requested features for PI Vision. However, AVEVA has clearly stated that this will not be part of PI Vision any time soon.
Customizeability
In terms of customizability, some customers find PI Vision lacking compared to Processbook. Users who previously enjoyed tailoring Processbook to align with their company's branding or to enhance readability have noticed a shortfall in PI Vision. The transition has led to some display features being missed, making it more challenging for operators to easily view and interpret the data.
Limited Visualization Options
PI Vision has a limited ranged of visualization options. Our customers are mentioning missing data entry options, bar charts or other forms of visualizations as essential for monitoring their processes.
Top PI Vision Extensions
1. Vision Library+ by Software Athlete

Software Athlete's Vision Library+ stands out in the market of PI Vision symbol collections due to its superior features, especially in terms of customizability. Unlike other collections, Vision Library+ offers a broader range of customization options, allowing users to tailor their data visualizations more precisely to their specific needs. This enhanced customizability, along with other advanced features, sets Vision Library+ apart, making it a more versatile and effective choice for users seeking comprehensive and adaptable visualization tools in PI Vision.
Vision Library+ is by far the most advanced PI Vision Symbols Collection on the market. It has all the missing features that are required by most customers: Data Entry support, advanced charting options (e.g. Bar Charts) and other important usability controls like Navigation Menus and DateTime Pickers, that enhance the overall experience of PI Vision.
Symbols
Vision Library+ includes 21 (and counting) highly customizable symbols:
- Combo Chart+
- Gantt Chart+
- Histogram+
- Heatmap+
- Pie Chart+
- Manual Data Entry+
- Manual Input Table+
- Time Series Table+
- AF Table+
- Events Table+
- DateTime Picker+
- Navigation Menu+
- Web View+
- and more ...
All of these symbols are highly customizable and fully integrated into PI Vision.
Advantages
Vision Library+ has several advantages over it's competitors:
- Enterprise-ready: Install on-premise or in the cloud
- Frequent updates and new features: New Symbols and Features are added on a weekly basis
- Flexible pricing models: Volume discounts, software reseller discounts and partner programs for system integrators
- Enterprise-grade support: Software Athlete's customer support helps you install and configure your installation
Manual Data Entry
One of the best features of Vision Library+ is it's extensive support for manual data entry. From PI Points, Attributes to Event Frames - anything can be added and/or edited with Software Athlete's solution.

Advanced Charts
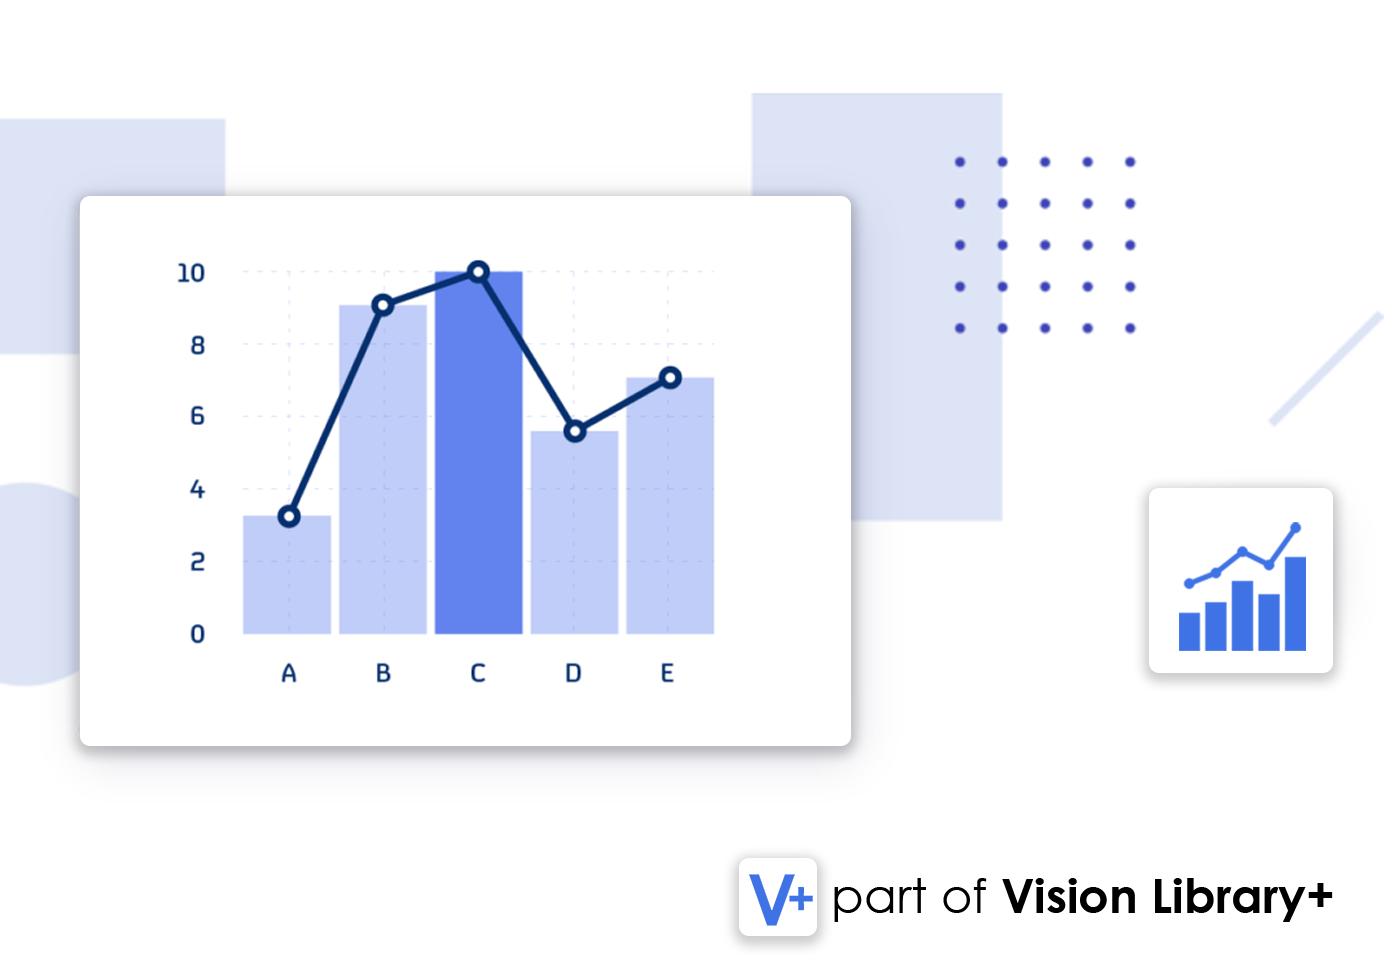
Vision Library+ adds advanced charting features to PI Vision, like Bar Charts, Heatmaps, Pie Charts & many more:


2. Other Symbol Collections
Manufacturing intelligence applications are mainly focused on tools that are specifically designed for the shop floor. These applications provide a variety of tools and modules that enable the continuous monitoring and management of production processes around the clock. Some of the features available in these applications include dashboards, reports, SPC/SQC tools, downtime tracking, and others that are deemed necessary for efficient production management.
Although PI Vision stands out in this category with its exceptional dashboarding capabilities, there are a number of alternatives in the market that can provide equally impressive results. Specifically, when advanced functionality such as SPC is taken into account, there are several viable options available. Therefore, anyone searching for a PI Vision alternative should consider broadening their requirements to include these advanced features to find the best match for their specific needs.
PI Vision Symbols Collections: Conclusion
While PI Vision may be a popular choice for process data visualization and analysis, it has its fair share of limitations and shortcomings. Vision Library+ however is a great piece of software that expands the scope of PI Vision and adds much needed features, making it the number 1 visualization tool on the market.


![Best PI Vision Custom Symbol Extensions [2025]](http://www.software-athlete.com/cdn/shop/articles/best_f6659eb6-003b-423c-bbf0-ec02db6aea42_1280x1100_crop_center.png?v=1752655802)


