Announcement
We have released a new extension for PI Vision, Vision Audit+. It tracks every display change with user and timestamp, and allows reverting to previous display versions, as well as restoring deleted displays. You can learn more about it here.

New Symbols
Radial Gauge+
This update introduces an entirely new custom symbol, the Radial Gauge+. Radial Gauge+ is an advanced custom symbol for AVEVA PI Vision that, that supports multistate color ranges, different display types (bars, markers, needles) and multiple data sources on a single scale. Learn more about it here.

New Features
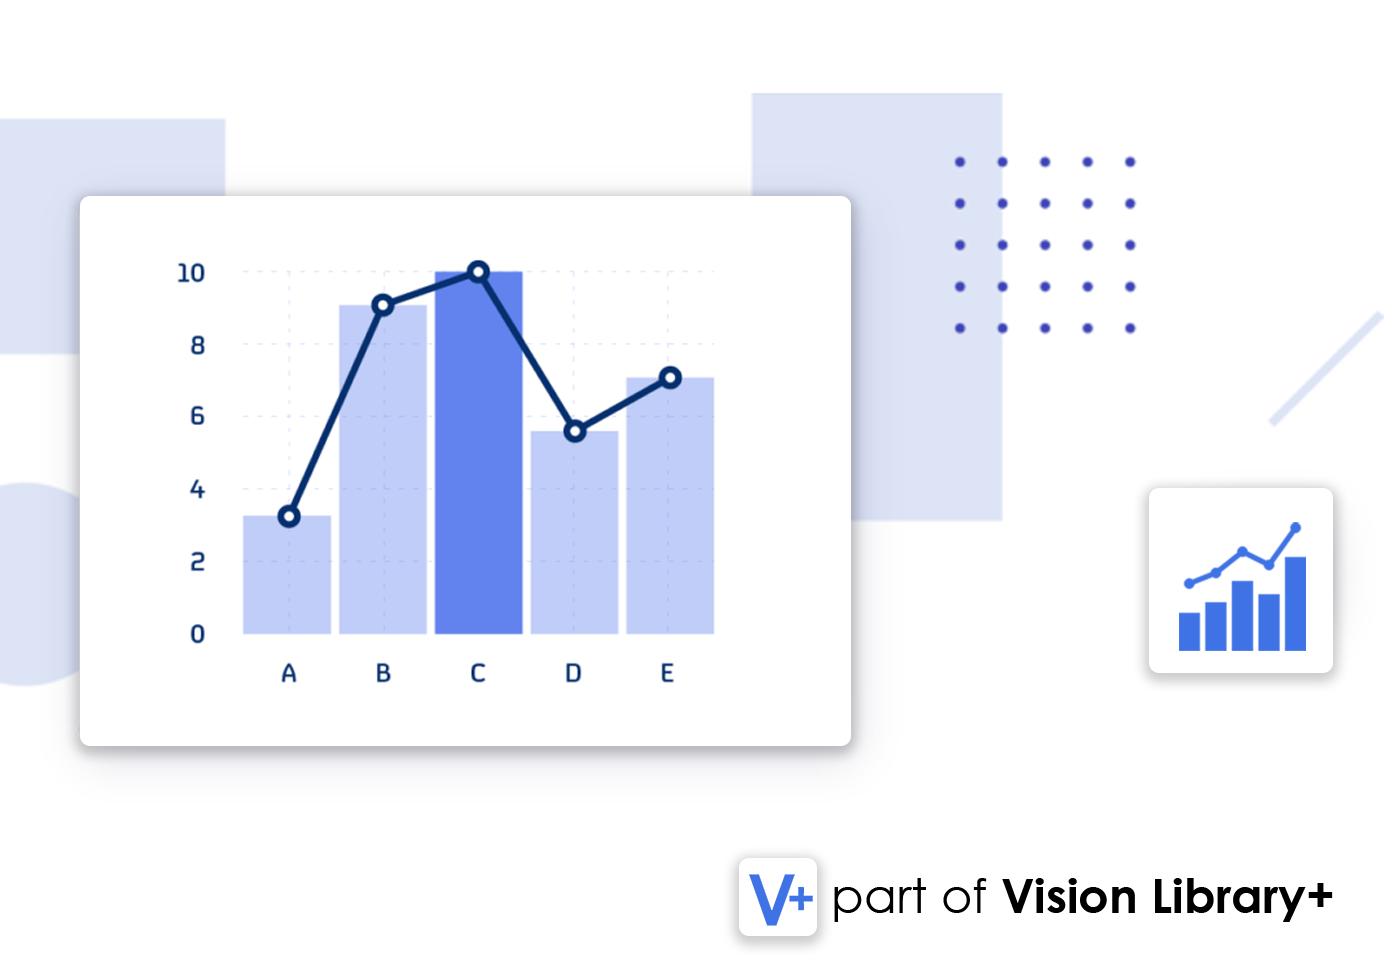
Combo Chart+
- The statistics table is now available for all data retrieval methods.
- Log scale now supports multistate
Manual Input Table+
- User logging now also works if the user column is not editable
Sankey+
- New option to configure static flows
Events Table+
- Add and download event frame comment attachments
- Splitting events now will leave the original event open, and create a new closed event. This change was made so that event frame generation is able to close event frames that have been split before.
Manual Data Entry+
- New column filters option
Map+
- View Buttons can now be hidden from the user
AF Table+
- Filters are now available if the table is in "Write" Mode
- Rows can now be deleted in the "Range" Mode
Bug fixes
- General: Fixed an issue where referenced elements were not loaded properly
- Events Table+: Fixed Referenced Element Attributes not showing the correct UOM
- General: Table cells in edit mode will now use the correct font size
- Asset Symbols: Fixed an issue where displays could not be saved
- Asset Symbols: Fixed an issue where migrated displays were prompting a save everytime they were opened
- Combo Chart+: When clicking on an event frame, the chart will now open the correct event frame, if there are multiple event frames with the same name
- Combo Chart+: Fixed an issue where summaries were not calculated properly
- Map+: Fixed an issue where the adhoc-trend was now opening
- General: The Adhoc Chart will now display boolean and digital values using the stepped curve


