New Symbols: Event Frame Analytics
This update introduces a powerful new suite of symbols focused on Event Frame Analytics and interactive dashboarding. These tools allow you to aggregate, summarize, and filter your event frame data to create dynamic, data-driven displays.
This release includes three brand new symbols:
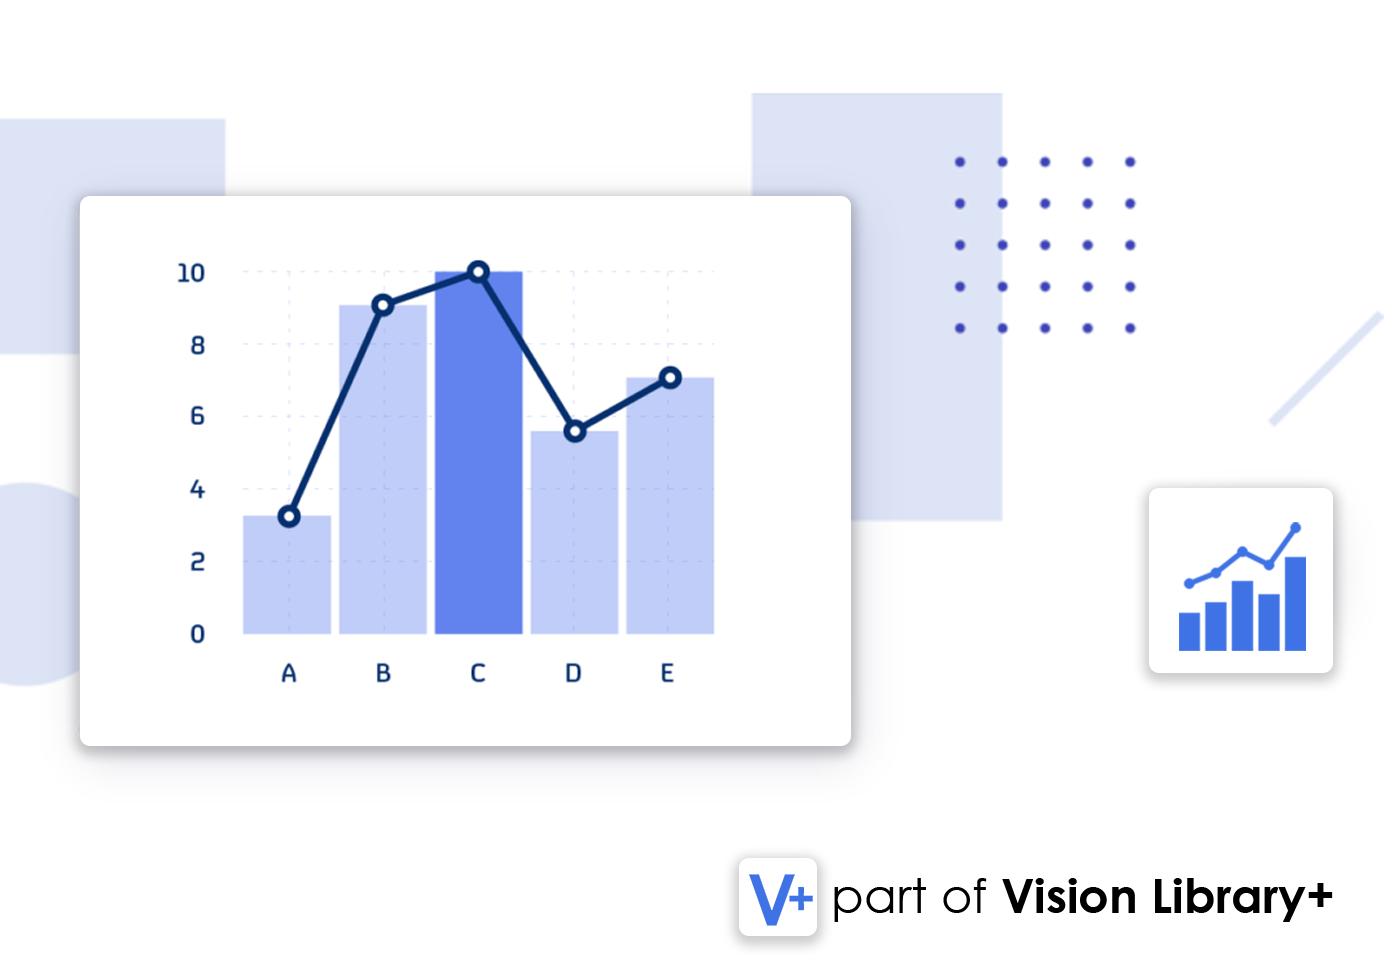
Event Analytics Chart+
A highly configurable Cartesian chart that aggregates event frame data into bars, lines, or areas. Use it to visualize trends and compare totals for different event categories.

Event Analytics Pie+
A versatile pie and doughnut chart that visualizes the proportional breakdown of your event frame data. It's perfect for showing the relative contribution of different attributes.

Event Filter+
An interactive filter control that acts as a "Master Filter" for your display. Select items from the list to dynamically filter all other compatible analytics symbols on the display.
New Features
Value+ (1.58.1):
- Option to globally configure the displayed tooltip label
- Option to globally configure the point attributes
- Improved tooltip positioning
Asset Comparison Table+
- Edit Mode now supports Copy & Paste
- Configurable save time stamp
- New option for deleting values
Asset Select+
- Navigation Link now supports setting asset context as root
Sankey+
- New option to configure static flows
Combo Chart+
- Cursor tooltip is now available in collectinos
Data Entry Symbols+
- if the user has unsaved changes, the website will alert the user before leaving the display without saving
Map+
- Configurable default styles for .geojson files
Navigation Menu+
- The dropdown menu will now always be displayed on top of other symbols
- The dropdown items will now automatically flow over to another column if there's not enough space to display them all
Manual Input Table+
- An asset context switch will now clear the table
Manual Data Entry+
- When saving using pi time notations such as * or t, the symbol will now use the clients timezone instead of the servers
Bug fixes
- General: The joined Data Retrieval mode had an incorrect order if the base datasource was not the first one
- General: Fixed some issues with bearer authentication
- Navigation Menu+: Start and Endtimes are now correctly url encoded
- Time Series Table+: Fixed a bug where a value at exactly the start time was not displayed
- Histogram: Fixed an issue where an asset context switch was not updating the histogram
- Excel exports: Now use the correct date time format
- Manual Input Table+: Fixed an issue where file uplodas where not working


