


PI Vision Custom Symbol
Visualize Proportions with Interactive Pie & Donut Charts
Easily represent the composition of your data. Pie Chart+ is a powerful and user-friendly tool for creating a wide range of professional, insightful, and visually appealing circular charts.
From Raw Numbers to Clear Insights
Versatile Charting Options
- Multiple Chart Types: Create standard pie charts, modern donut charts, and space-saving half-donut charts.
- Polar Chart Support: Visualize cyclical data or compare multiple categories with an intuitive polar area chart.
- Responsive by Design: All chart types automatically adapt to look great on any screen size or device.
Insightful Data Display
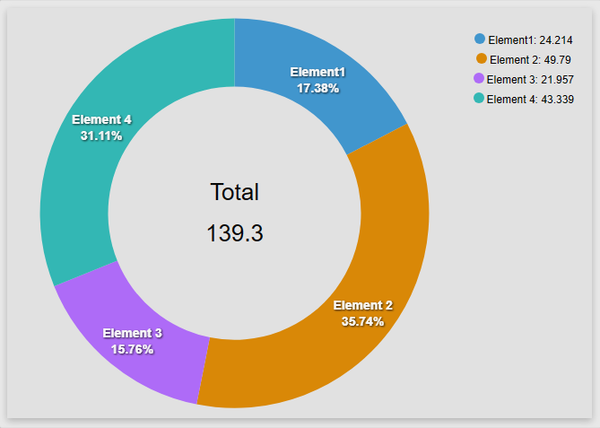
- Dynamic Center Label: Display the sum of all data points in the center for a quick, at-a-glance total.
- Clear Data Labels: Show values, percentages, or category names on each slice for easy interpretation.
- Interactive Tooltips: Hover over any slice to reveal detailed information and exact values.
Total Visual Control
- Highly Customizable: Adjust colors, styles, fonts, and sizes to align with your brand or dashboard theme.
- Legend Configuration: Control the position and appearance of the chart legend for optimal layout.
- No-Code Configuration: All settings are managed through a simple and intuitive panel within PI Vision.
Answer Key Business Questions Visually
Asset & Downtime Analysis
Visualize the distribution of downtime reason codes to identify the most frequent causes of production loss.
Production & Quality Breakdown
Display the percentage of products in different grades (e.g., prime, off-spec) or the breakdown of quality issues.
Energy & Cost Allocation
Show the proportion of energy consumption by different areas of a plant or the allocation of costs by department.
KPI Monitoring
Illustrate the composition of a key performance indicator, such as the contribution of different assets to total output.
From Classic Pies to Modern Polar Charts

Versatile Chart Types
Choose from a variety of chart types, including round, donut, half-donut, and polar charts, to best fit your data.

Dynamic Center Label
Display the sum of all data points in the center of your donut charts for a quick, at-a-glance summary.
Customizable Appearance
Take full control over colors, styles, fonts, and labels to align with your branding or presentation style.

Professional Presentation
Create clean, modern, and impactful visualizations that make your data easy to understand.

Responsive Design
Ensure your charts look perfect and remain readable on any device, from large control room screens to tablets.
See Pie Chart+ in Action
Demo Coming Soon

Questions?
Click the button below to get in contact, or simply email us at contact@software-athlete.com. We would love to help you.


