In demanding production environments like Oil & Gas, Chemicals, Energy, Mining and Pharmaceuticals, accurate and timely operator logs are the backbone of efficient operations, safety, and compliance. Traditional methods often involve disparate systems, paper logs, or clunky spreadsheets, leading to information silos, delayed communication, and difficult analysis.
Imagine a world where your operators can seamlessly log critical events directly within their familiar PI Vision displays, capturing rich, structured data that’s immediately available for trending, analysis, and reporting.
Thanks to Vision Library+ and its powerful Events Table+ custom symbol, that world is now a reality. This guide will walk you through the entire process, from defining your structured log entries using PI AF Event Frame Templates to empowering your team with a live, editable operator log in PI Vision. And stick around for a bonus section on how to automatically share these critical logs with managers using Vision Report+!
Why Structured Operator Logs Matter
-
Consistency: Standardized data entry ensures all necessary information is captured.
-
Searchability: Easily find specific events, issues, or actions taken.
-
Analysis: Trend event frequency, correlate events with process data, identify recurring problems.
-
Reporting: Generate automated reports with Vision Report+ that include structured event data, reaching the right people at the right time.
-
Accountability: Track who did what, when, and where.
Prerequisites
Before we dive in, ensure you have:
-
AVEVA PI Vision: Your operational dashboard environment.
-
PI AF (Asset Framework): Where your event frames will reside.
-
Vision Library+ and Events Table+ Custom Symbol: These are your custom extensions developed for PI Vision. (Make sure they are properly installed and configured on your PI Vision server.)
-
Vision Report+ Extension: Your automated reporting tool for PI Vision. (Ensure it's installed and configured).
Step 1: Define Your Operator Log Structure with PI AF Event Frame Templates
The secret to structured, consistent event logging lies in using PI AF Event Frames. These event frames are your log entries, ensuring every operator captures the same vital information.
For production industries, let's consider a versatile "Production Operator Log" template that can capture various event types, from routine observations to critical warnings.
1.1. Open PI System Explorer and Navigate to Your AF Database
-
Launch PI System Explorer.
-
Connect to your AF Server and the relevant database (e.g., "ProductionOperations" or your plant's specific database).
1.2. Create a New Event Frame Template
-
Under your database, navigate to Library > Event Frame Templates.
-
Right-click on Event Frame Templates and select New Template.
-
Name it something descriptive, like "Production Operator Log".

1.4. Define Attributes (Your Log Entry Fields)
This is where you specify the information your operators will capture. Think about what's critical for decision-making, auditing, and analysis.
-
Click on the Attribute Templates tab within your "Production Operator Log" template.
-
Click New Attribute Template and define the following, paying close attention to their Data Type and set the Manual Data Entry flag:
Attribute Name Data Type Description Values/Example Required? Log Type Enum Classification of the log entry. Create an EnumSet: Information, Warning, Critical, Downtime, Maintenance, Safety, Quality Yes Operator Name String Name of the operator making the entry. Jane Doe Yes Shift Enum The work shift the event occurred on. Create an EnumSet: Day, Afternoon, Night Yes Location/Unit Referenced Element Specific area, unit, or asset where the event occurred. Reactor B, Unit 3 Boiler, Well Pad C
You can use a custom Enum or Referenced Assets for this example
Yes Description String Detailed account of the event or observation. Low pressure alarm on pump P-101. Investigated and found minor leak. Yes Action Taken String/Enum Steps taken in response to the event. Isolated pump, notified maintenance. No Equipment Affected String Specific equipment tags or names involved. P-101, Heat Exchanger HX-205 No Severity Event Frame Severity Impact level of the event. Create an EnumSet or use default event frame severities: Low, Medium, High Yes (for Warnings/Criticals) Status Enum Current state of the event. Create an EnumSet: Open, Closed, In Progress Yes

1.5. Create Enumeration Sets (EnumSets)
For attributes with predefined choices (Log Type, Shift, Severity, Status), you'll need to create Enumeration Sets first.
-
In PI System Explorer, navigate to Library > Enumeration Sets.
-
Right-click and select New Enumeration Set.
-
Name it (e.g., LogTypes, Shifts, Severities, EventStatuses).
-
Add the desired values to each set.
1.6 Create Assets (AF Elements)
- If you want to have different locations for each operator log, create Assets inside your database for the users to choose from
Step 2: Build Your Operator Log Display in PI Vision
Now that your Event Frame Template (the blueprint for your log entries) is ready, let's create the PI Vision display where operators will interact with it.
2.1. Open PI Vision and Create a New Display
-
Launch AVEVA PI Vision.
-
Start a New Display or open an existing display where you want to embed the operator log.
2.2. Add the Events Table+ Custom Symbol
-
On the left-hand pane, navigate to the Event Frames Section.
- Edit the Search Criteria: Select your database and the Event Type Production Operator Log

- Important: Create an Event Frame of that Type in PI System explorer, so the search criteria is not empty.
-
Select the Events Table+ custom symbol and drag any of the event frame attributes onto the display
- Then drag all other attributes onto the Events Table+ that are required for inputs

2.3. Configure the Events Table+ Symbol
This is where the magic happens! Right-click the symbol and open its Configuration Pane.
- Configure Columns
-
-
Hide the columns Event Name, End Time and Acknowledgement. We do not need these.
-
Rename the column Start Time to Event Time and move it to the top
- Rename the column Asset to Location
- If required, enable the Comments field, so multiple people can comment on an event
-
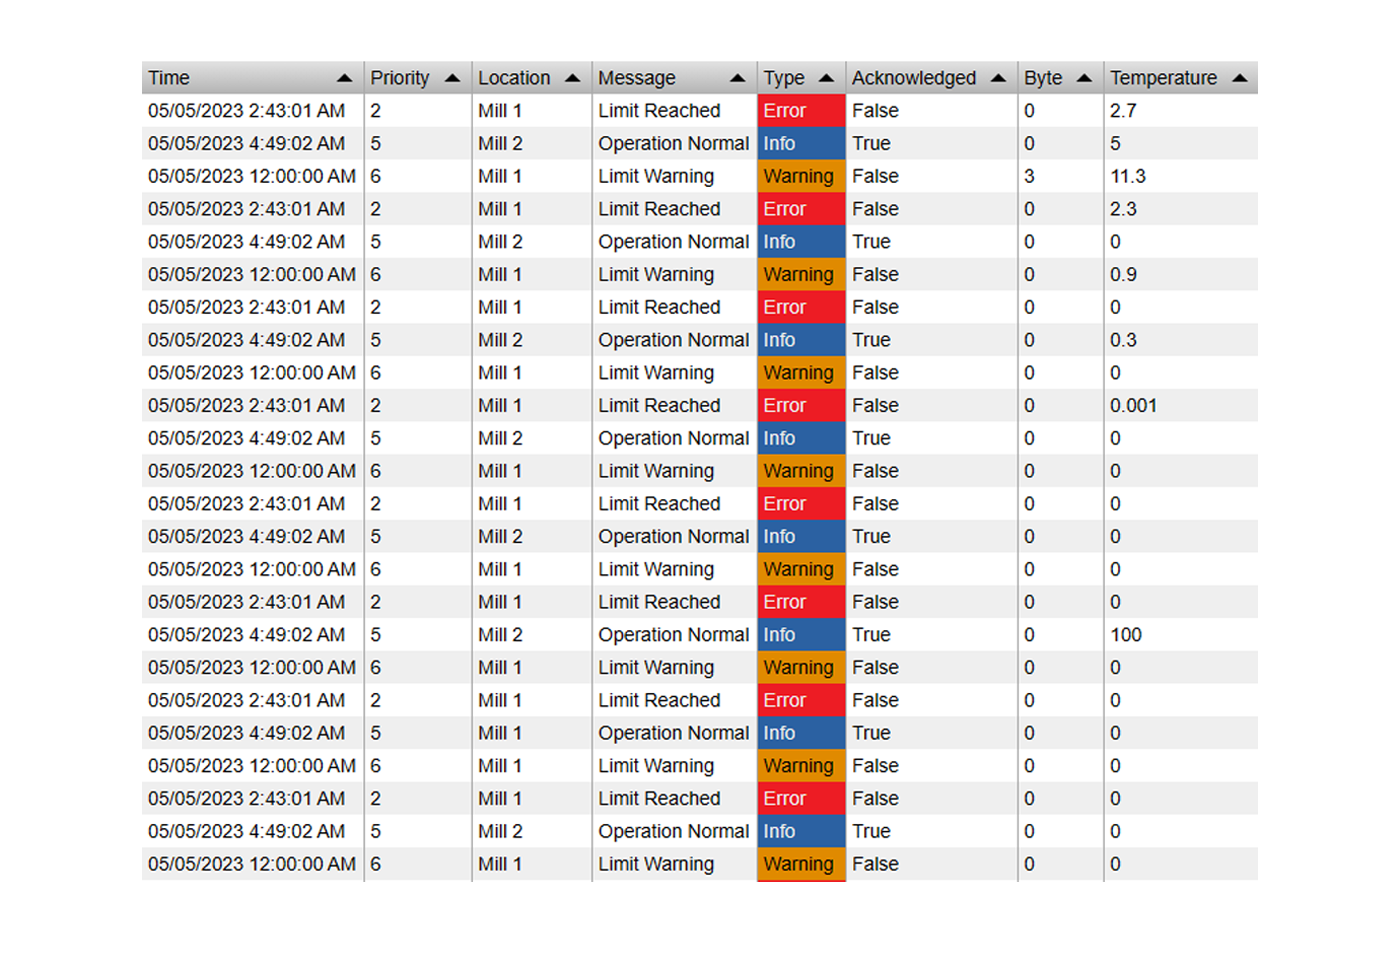
Your table will then look like this:

-
Enable Editing
-
Go to Interactivity > Edit and set the Mode to Edit
-
Go to Creation and Enable Event Frame Creation.
-

-
Add Creation Button:
-
Next we want to create a button for the user to create the actual event frame. In the Buttons section, click the add (+) button.
-
Name and Style: Select a Name, Icon and Color for the button
-
Template: From the dropdown menu, select the Production Operator Log Template
-
Open Dialog: We keep this enabled, so the user will be prompted with a dialog when clicking the button
-
-
Configure Properties: Next we want to define the default values and available fields for the event creation dialog
-
Name: Hide the Name by clicking the eye icon, we don't want the users to give a event frame name.
-
Asset: Enable this one
-
Start Time: Hide this field, and set the default value to *
- End Time: Hide this field, and set the default value to *
- Severity: Show this field
- Description: Hide it, as we will be using our own Description Attribute
-
Clicking the button will now prompt the user with two fields: Asset and Severity. When accepted, it will create an event of type Operator Log.

-
Configure Attributes
- Next we want to add our attributes to the creation form. Select each Attribute and add it to the list by clicking the add (+) button.
-
Set default values as required
- For the operator name, set %user% to automatically enter the current user

The final event creation dialog will then look like this:

The final result of the table:
2.4. Save Your PI Vision Display. Name it something clear, like "Production Operator Log Display."
Step 3: Logging Events (as Event Frames) in PI Vision
With your display configured, your operators can now seamlessly add and manage their Event Frame-based logs.
3.1. Viewing Existing Event Frame Logs
-
When operators open the display, they will see a table displaying all "Production Operator Log" event frames that match the configured time range and filters.
3.2. Adding a New Event Frame Log Entry
-
Operators simply click the "New Event" button (which appears because you enabled "Enable Event Frame Creation").
-
A form will pop up, populated with the attributes you defined in your Event Frame Template.
-
Operators fill in the required fields (e.g., Log Type, Operator Name, Description, Severity, Status).
-
The Start Time and End Time will typically default to the current time, but can be adjusted if logging a past event frame.
-
Click "Save". The new event frame is immediately created in PI AF and appears in the Events Table+.
3.3. Editing an Existing Event Frame Log Entry
-
Operators can modify any of the Editable attributes. This is perfect for updating the Status of an event frame from "Open" to "Closed" or adding Action Taken after an issue is resolved.
-
Click "Save" to apply changes to the event frame.
3.4. Searching and Filtering Event Frame Logs
-
Operators can use the built-in search bar to quickly find specific event frames by keywords.
-
They can also adjust the time range to view event frames from different periods.

The Power Unlocked: Beyond Simple Logging
By implementing this solution with Vision Library+ and Events Table+, you're not just creating a logbook; you're building a foundation for operational excellence using powerful PI AF Event Frames:
-
Real-time Insights: Event frame log entries are immediately available for all relevant stakeholders.
-
Contextual Data: Correlate event frame data with process data from your PI System on the same displays.
-
Improved Communication: A centralized, accessible log reduces miscommunication and delays.
-
Audit Readiness: A clear, timestamped, and attributed record of operational event frames.
Vision Library+ and Events Table+ transform PI Vision from a mere data visualization tool into a dynamic, interactive platform for managing critical operational information by leveraging the power of PI AF Event Frames. When coupled with Vision Report+, you create an end-to-end solution for capturing, visualizing, and disseminating vital operational intelligence across your organization.
BONUS SECTION: Automate Operator Log Reports with Vision Report+
Now that your operators are seamlessly logging events directly in PI Vision (as PI AF Event Frames!), let's take it a step further. Imagine plant managers and shift supervisors receiving a concise, pre-formatted PDF summary of all significant operator logs, delivered straight to their inboxes at critical times – like the end of a shift or every morning.
This is precisely what Vision Report+ empowers you to do! By combining the structured data capture of Events Table+ (which is Event Frame data!) with the automated delivery of Vision Report+, you eliminate manual reporting, ensure consistency, and keep key personnel informed without delay.
How it works: Vision Report+ connects to your PI Vision server, takes a "snapshot" of your configured display (including your live Events Table+ full of Event Frames), converts it into a PDF, and emails it to a predefined distribution list.
Steps to Automate Operator Log Reports:
1. Ensure Vision Report+ is Installed and Configured:
* Verify your Vision Report+ server and web interface are accessible.
2. Create or Select Your PI Vision Operator Log Display:
* Create a new Report named Operator Log Report
3. Create a separate display for your events
* And use this as the basis for the report
4. Set the trigger
* Define your report trigger (like every day at 06:00 AM and 06:00) PM
5. Define Email recipients
* Enter the list of email addresses the report should be sent to
Now sit back, and watch your report be automatically generated and sent to you via email, with everything that was logged by operators. Below you can see an example PDF:

Ready to revolutionize your operator logs and operational reporting?
Learn more about Vision Library+ and download Events Table+ today!
Discover how Vision Report+ can automate your PI Vision reports, including your new operator logs.
Contact us for a personalized demo or to discuss your specific needs.


