AVEVA has released PI Vision 2025 with long-awaited admin features and trend improvements. We break down the new features and explain why pairing them with Vision Library+ creates the ultimate dashboarding experience.
The Good News: New Features
The 2025 update focuses heavily on "Quality of Life" improvements for administrators and engineers. Here are the standout features.
For the Analyst
- Sort by Value: Dynamic collections can now be sorted by attribute value. You can finally see your "Top 5 Hottest Assets" automatically.
- Trend Upgrades: Group traces to share scales, add regression lines for analysis, and retain cursors.
- Transpose Tables: Orient assets as columns to easily compare assets with high attribute counts.
For the User
- Ad Hoc Workspace: Access the workspace directly from the homepage or via URL to create quick trends.
- Tooltip Config: Toggle tooltips on/off and include descriptions or PI Point paths.
- Copy Data Context: A new "Ctrl+C" feature allows you to copy datasource paths from symbols directly into tools like PI DataLink.
For the Admin
- Recycle Bin: Deleted displays are now moved to a Recycle Bin for easy recovery.
- Folder Management: Set specific permissions for the Home folder and use the "Unorganized" area.
- Calculation Limits: Restrict users' ability to create resource-intensive calculations via the Admin site.

The "Safety Net" vs. The "Time Machine"
The new Recycle Bin is a welcome addition, but it has a critical blind spot. It only helps if you delete the entire display. But what happens when a user accidentally deletes a complex symbol, breaks a calculation, or overwrites a critical dashboard?

Native 2025: The Recycle Bin
What it does: Recovers displays that were fully deleted.
The Limitation: It cannot revert changes. If a user opens a display, deletes all the trends, and hits "Save," the Recycle Bin cannot help you. The display still exists, but the content is lost forever.

Software Athlete: Vision Audit+
What it does: Full Version Control.
The Solution: Our auditing tool tracks every change. It logs who changed a display and when. Most importantly, it stores the display XML for every version. You can roll back a display to how it looked last Tuesday, even if it wasn't deleted.
The Visualization Gap
PI Vision 2025 improves the foundation, but it didn't introduce radical new ways to visualize data. To get users excited about your data, you need to go beyond standard tables and trends.
Advanced Dashboarding
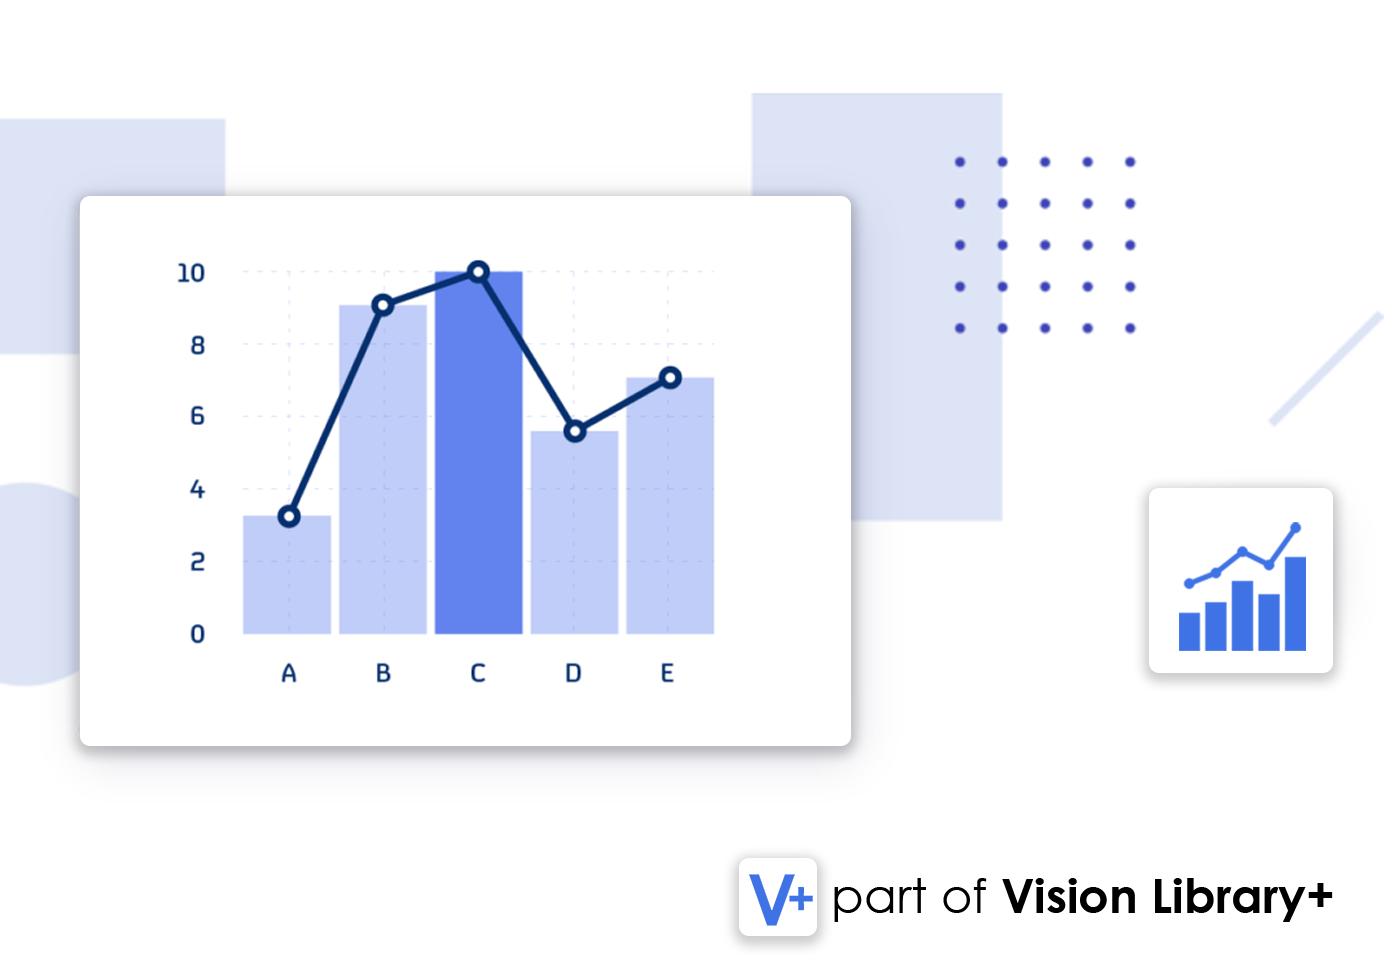
2025 lets you sort assets by value. Vision Library+ lets you visualize that data with Sunburst charts, Sankey diagrams, and interactive Maps that native PI Vision simply cannot do.
View the Collection →Automated Reporting
Don't just view the data on screen. Use our Reporting tools to automatically capture your high-fidelity displays and email them as PDFs to management every morning.
See Reporting Tool →Context & Interaction
The 2025 "Copy Context" feature is great, but Vision Library+ allows for complex click-events, drill-downs, and breadcrumb navigation within the display itself.
Upgrade Your Strategy, Not Just Your Server
PI Vision 2025 provides the stability and admin tools you need. Vision Library+ provides the user experience your team deserves.