Event Analytics Pie+ for AVEVA PI Vision

PI Vision event frame pie charts by reason, asset or type

See which reasons, assets or event types account for most of your downtime, losses or events. Event Analytics Pie+ summarises PI AF Event Frames into pie and donut charts in your PI Vision display.

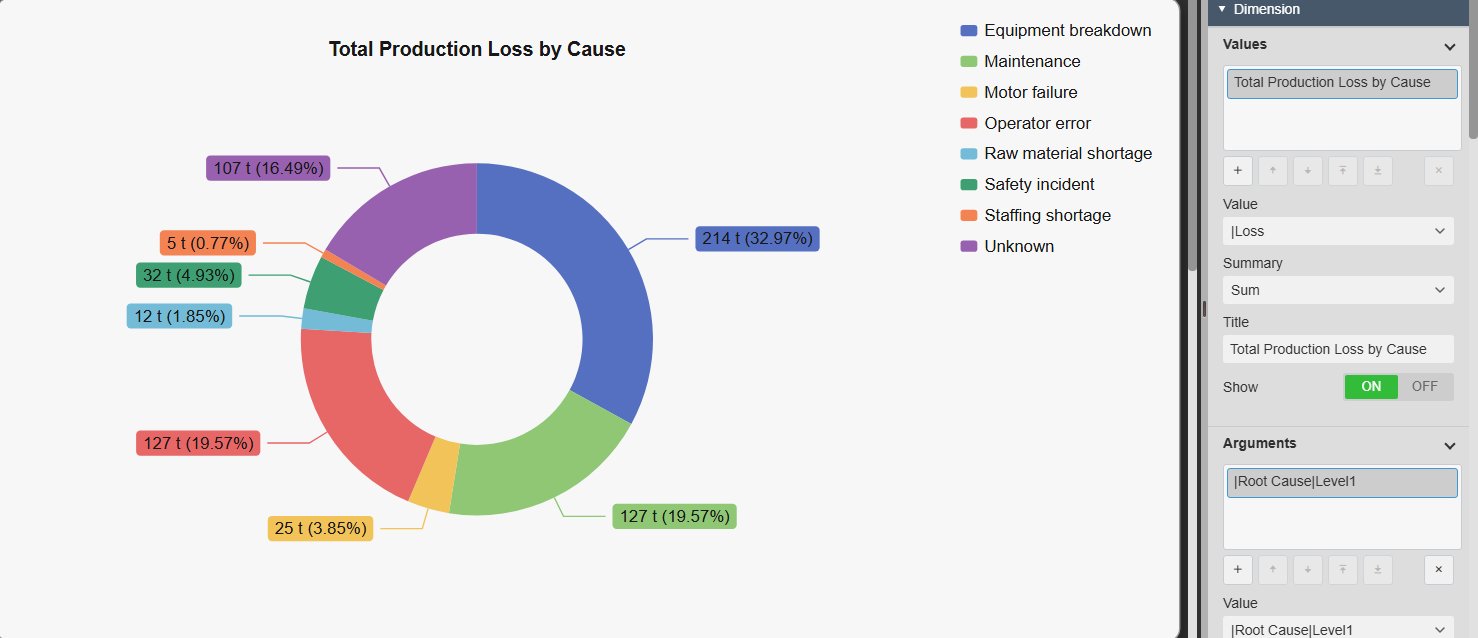
Event Analytics Pie+ in PI Vision showing the total production loss of downtime Event Frames per root cause as a donut chart, with value and percentage labels and a legend, next to the Values settings with the Loss attribute, the summary Sum and the title, and the Arguments settings with the root cause
Event Analytics Pie+ v2.0 in PI Vision: production loss per root cause from downtime Event Frames. Demo data. Select the image to enlarge.

Event frame pie charts in PI Vision

Point the symbol at an Event Frame search, choose what to measure, and every slice shows the share of one category.

Count events or sum their durations and losses

Each slice summarises the Event Frames of one category, so one symbol shows which reasons cause the most events, hours or cost.

  • Its own Event Frame search: database, event template, assets, time range and other search criteria.
  • Count events per value of a text attribute, such as a reason code or a planned/unplanned classification.
  • Sum, Average, Minimum, Maximum, Median and Standard Deviation for numeric attributes and the event duration.
  • Event Frame attributes from the search, plus properties such as Duration, Asset and template name.
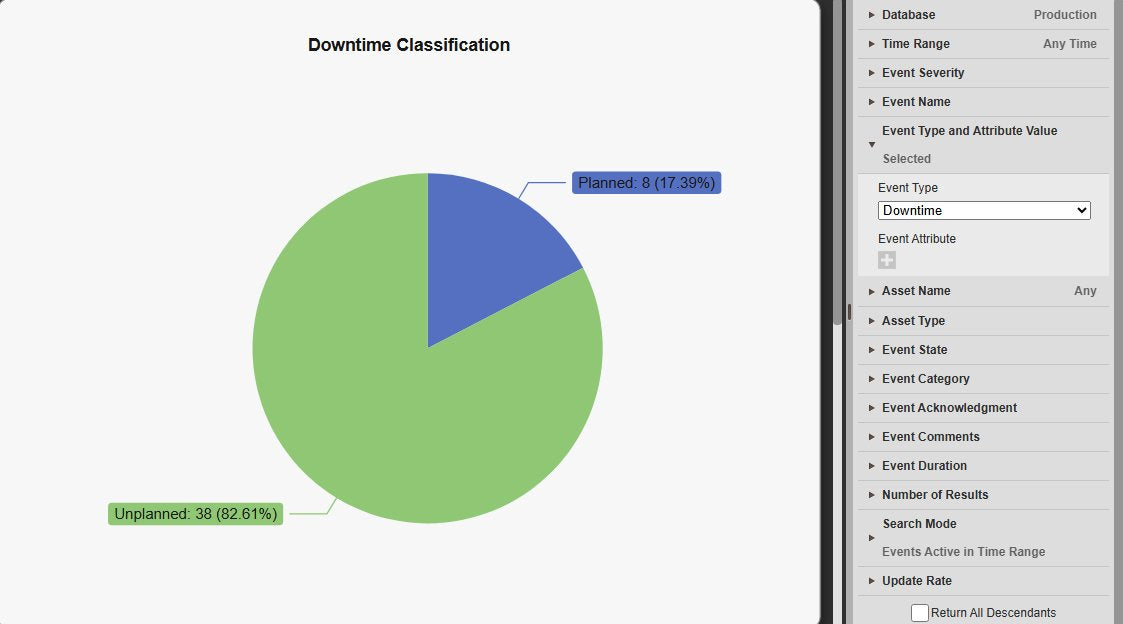
Event Analytics Pie+ with the number of planned and unplanned downtime events as a pie chart with value and percentage labels, next to the PI Vision Search Criteria pane with the Production database, the Downtime event type and the search mode
The symbol’s own Event Frame search decides which events the pie counts. Demo data. Select the image to enlarge.

Pie or donut, labels and legend

Pick the chart type and labels that read best at the size the display gives the symbol.

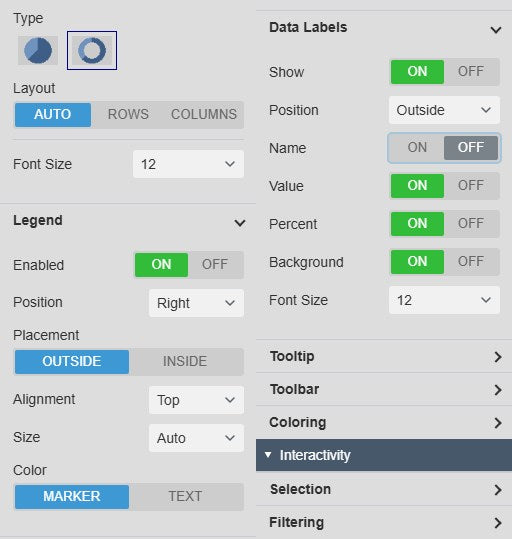
  • Pie or donut chart, with an automatic layout or rows or columns for several pies.
  • Data labels inside or outside the slices, with the category, the value and the percentage, and an optional label background.
  • Legend with position, placement, alignment and size; the tooltip shows category, value and share on hover.
  • Themes such as PI Vision, Light, High Contrast and Print, with flat or gradient surfaces and container styles.
Event Analytics Pie+ settings with the chart type Pie or Donut, the layout, the font size, the Legend group with position, placement and alignment, and the Data Labels group with position, name, value, percent and background
Chart type, legend and data label settings. Select the image to enlarge.

Break event frames down by reason, asset or type

Arguments decide what becomes a slice, Series decide how many pies you get.

Slices by reason or combined categories, with Top N

Use any Event Frame attribute or property as the slice category, and keep a long list of reasons readable.

  • One slice per value of an attribute or property, such as a root cause, a severity or the asset.
  • Hierarchy levels of an attribute, such as root cause level 1 or level 2, as their own categories.
  • Several arguments combine into more detailed slices, such as a root cause and its sub-cause.
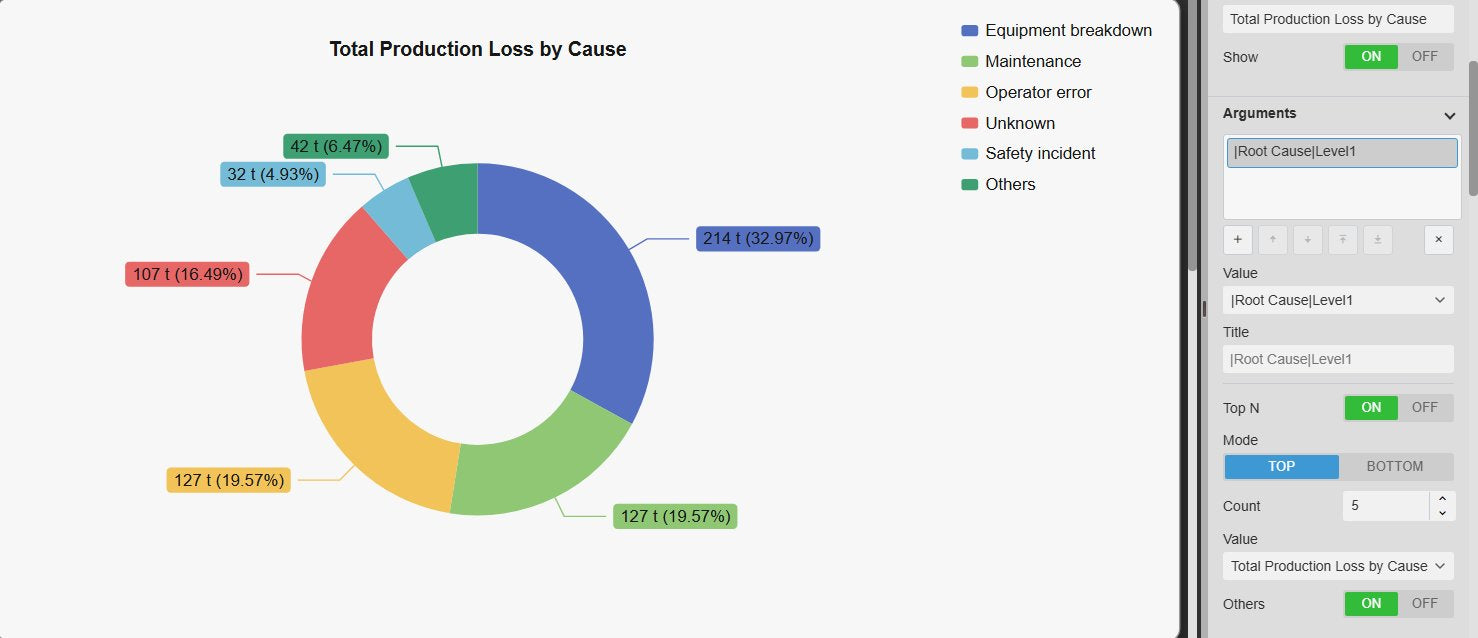
  • Top or bottom N slices, with the remaining categories in one Others slice.
Event Analytics Pie+ donut with the five root causes with the highest production loss and an Others slice for the remaining causes, next to the Arguments settings with Top N on, mode Top, count 5 and Others on
The five root causes with the highest loss and one Others slice for the rest. Demo data. Select the image to enlarge.

One pie per asset, line or event type

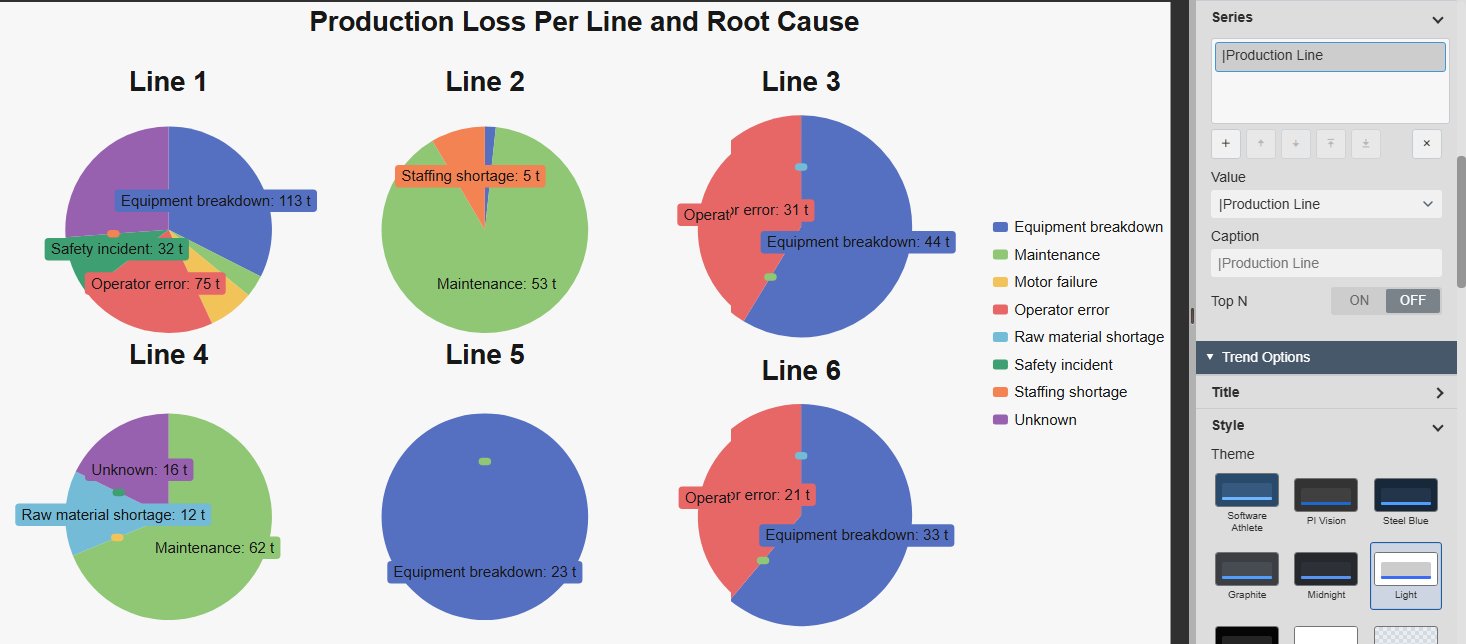
Add a series and the symbol draws a separate pie for each asset, line or event type, so their breakdowns sit side by side.

  • One pie per value of the series attribute, for example per production line or for planned and unplanned events.
  • A title above each pie and an overall chart title.
  • Automatic layout, or the pies arranged in rows or columns.
  • The same category keeps the same colour in every pie, and the legend lists the categories once.
Event Analytics Pie+ with one pie per production line, Line 1 to Line 6, each showing the production loss per root cause with a title above the pie and one shared legend, next to the Series settings with the Production Line attribute
Production loss per root cause, one pie per line. Demo data. Select the image to enlarge.

Drill down, filter and download event frame shares

Use the pie as the entry point of an event dashboard and take the numbers with you.

Drill down or filter the event dashboard

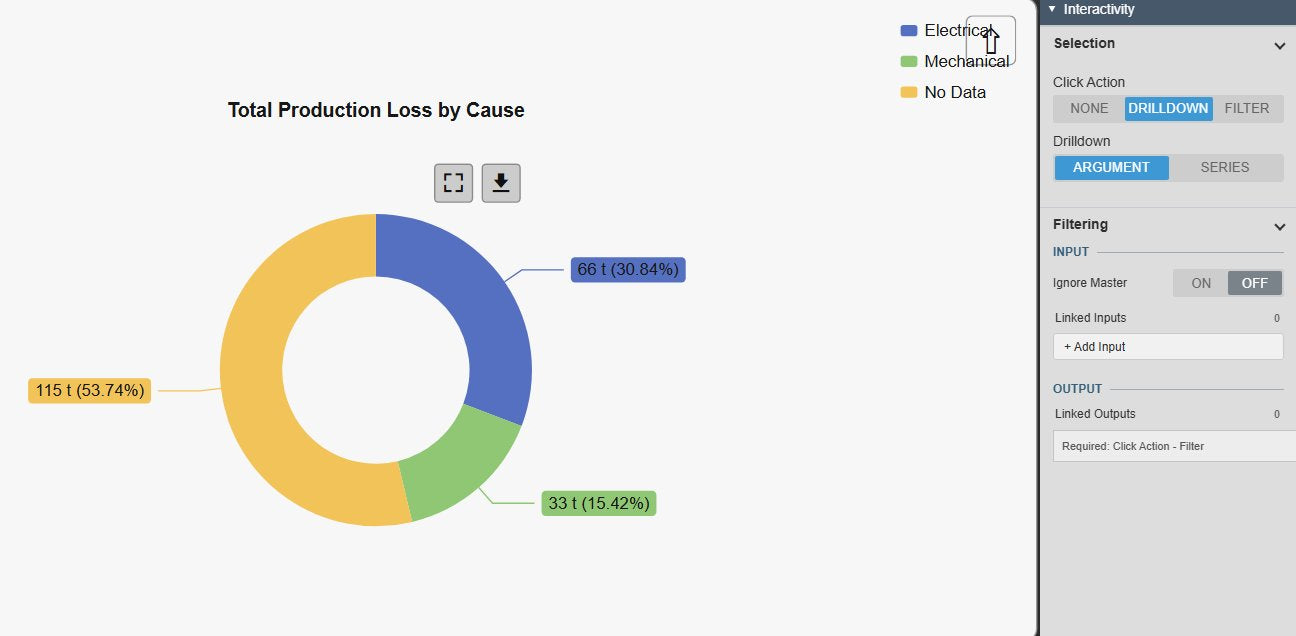
A click on a slice opens the next level of detail, or the pie can act as a filter for the other Event Frame symbols on the display.

  • Drilldown through the configured arguments or series, for example from root cause to sub-cause, with an up button to go back.
  • Click Action Filter sends the selected slice to other event symbols as a linked output.
  • Linked inputs from other event symbols, such as Event Filter+, narrow the events the pie summarises.
  • Ignore Master keeps the pie independent of master filters while linked inputs still apply.
Event Analytics Pie+ after a click on the Equipment breakdown slice, showing its sub-causes Electrical, Mechanical and No Data as a donut with an up button, next to the Interactivity settings with Click Action Drilldown, Drilldown Argument and the Filtering inputs and outputs
After a click on Equipment breakdown: its sub-causes and the up button. Demo data. Select the image to enlarge.

Full screen and download

Open the chart in a larger view and export what the pie shows.

  • Toolbar shown on hover or always.
  • Full screen view of the chart that keeps the current drilldown level.
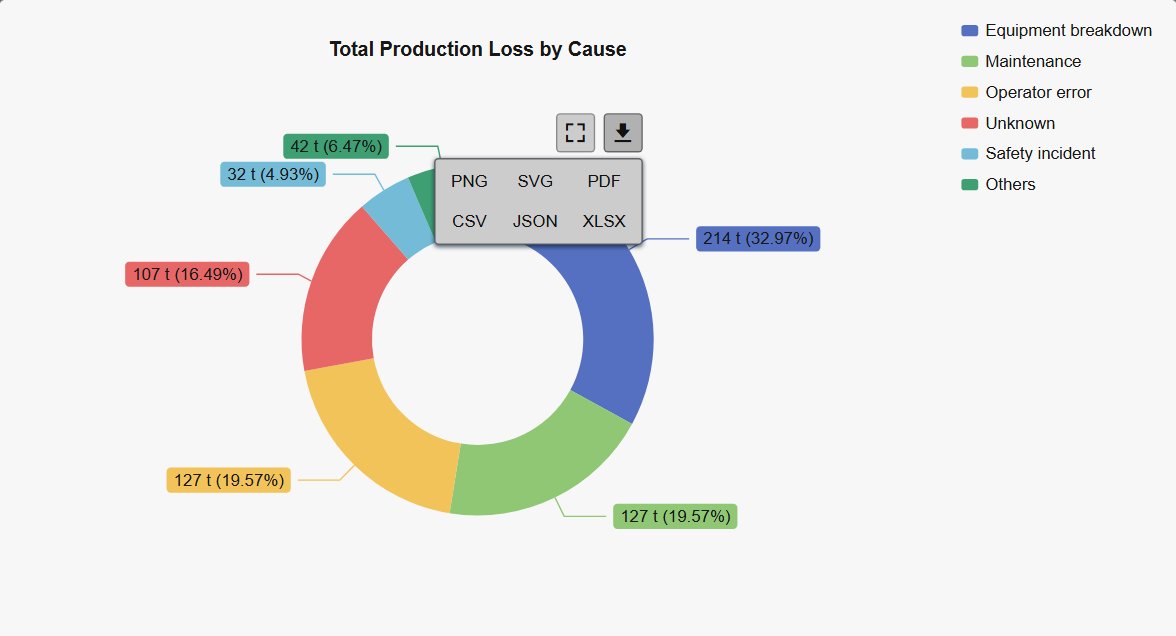
  • Download the chart as PNG, SVG or PDF, or its data as CSV, JSON or XLSX.
Event Analytics Pie+ donut with the toolbar buttons Full screen and Download, the download menu open with PNG, SVG, PDF, CSV, JSON and XLSX
Toolbar with the download formats. Demo data. Select the image to enlarge.

PI Vision event frame pie chart examples

Four common ways teams use Event Analytics Pie+ in their event and downtime displays.

Downtime by reason

Data
Downtime Event Frames with a reason code attribute
Settings
Value Sum of Duration, Argument reason code, Donut
Shows
Which reasons account for most of the downtime hours

Loss per line

Data
Loss Event Frames with a loss attribute on several lines
Settings
Value Sum of the loss, Argument root cause, Series production line
Shows
The loss breakdown of every line side by side

Planned and unplanned

Data
Event Frames with a planned or unplanned attribute
Settings
Value Count, Argument classification, Pie
Shows
The share of planned and unplanned events

Bad actor slices

Data
Event Frames on many assets
Settings
Value Count, Argument asset, Top N 5 with Others
Shows
The five assets with the most events and one slice for the rest

Event Analytics Pie+ FAQ

Questions we are asked most often. Read the Event Analytics Pie+ documentation or ask a technical question.

When should we use Event Analytics Pie+ rather than Pie Chart+ or Event Analytics Chart+?

Use Event Analytics Pie+ when the shares come from Event Frames, such as the number of events, their duration or a loss attribute per reason. Pie Chart+ shows PI points and AF attributes, one slice per data source, as a pie, donut, half donut or polar chart. Event Analytics Chart+ summarises Event Frames in the same way but draws bar, line or area charts, which suit many categories or a comparison over time.

Which Event Frames does the pie use?

The symbol runs its own Event Frame search. Right-click it and choose Search Criteria to set the database, event template, assets, time range and other criteria.

Can it sum event durations instead of counting events?

Yes. The event Duration and numeric attributes offer Sum, Average, Minimum, Maximum, Median and Standard Deviation, and the labels show durations as readable time spans. Text attributes such as a reason code are counted.

Does it work with Event Filter+ and Events Table+?

Yes. In the Filtering settings, linked inputs and master filters from Event Filter+, Events Table+ and the other Event Frame symbols narrow the pie, and Ignore Master keeps it independent of master filters. With Click Action Filter, a slice click filters the other symbols in turn.

What do we need to run it?

PI Vision 2021 or later with PI Web API, and PI AF Server 2018 SP2 or later with Event Frames. Event Analytics Pie+ runs in PI Vision and uses each user’s existing PI permissions.

How do we get Event Analytics Pie+?

Event Analytics Pie+ is part of Vision Library+, together with the other Vision Library+ symbols. Request a trial to test it in your own PI Vision environment.

Try Event Analytics Pie+ in your PI Vision

Event Analytics Pie+ is included in Vision Library+, the PI Vision custom symbol library from Software Athlete. Test it on your own displays and data.