Asset Filter+ for AVEVA PI Vision

PI Vision asset filter that narrows tables, charts and KPIs

Let operators choose which assets a display shows. Asset Filter+ lists the values of an AF attribute or asset property, such as operating mode, area or manufacturer, and one selection narrows the compatible Vision Library+ symbols on the same display.

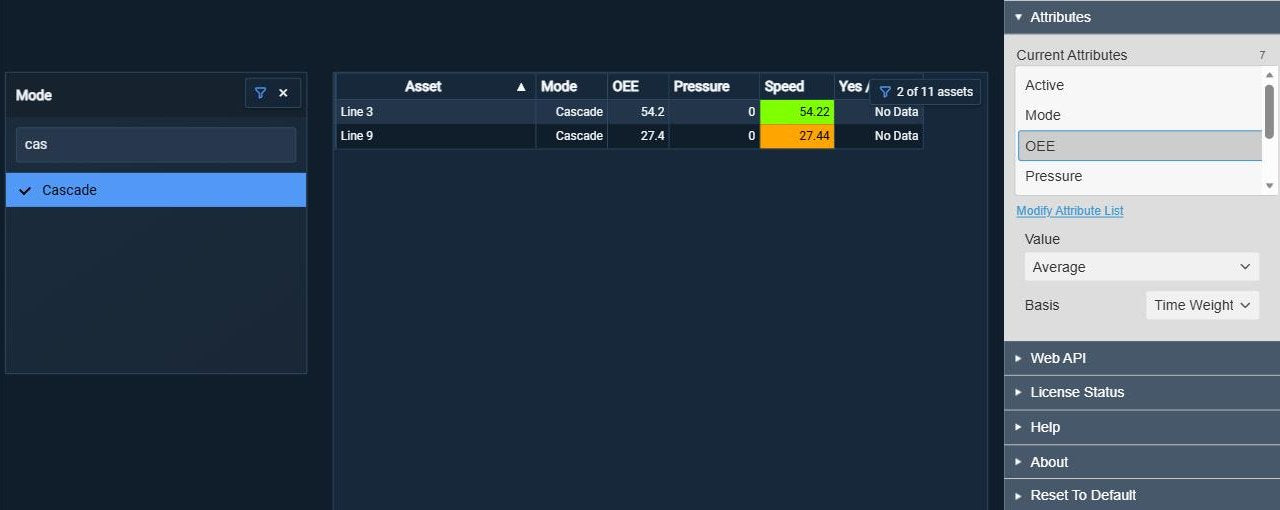
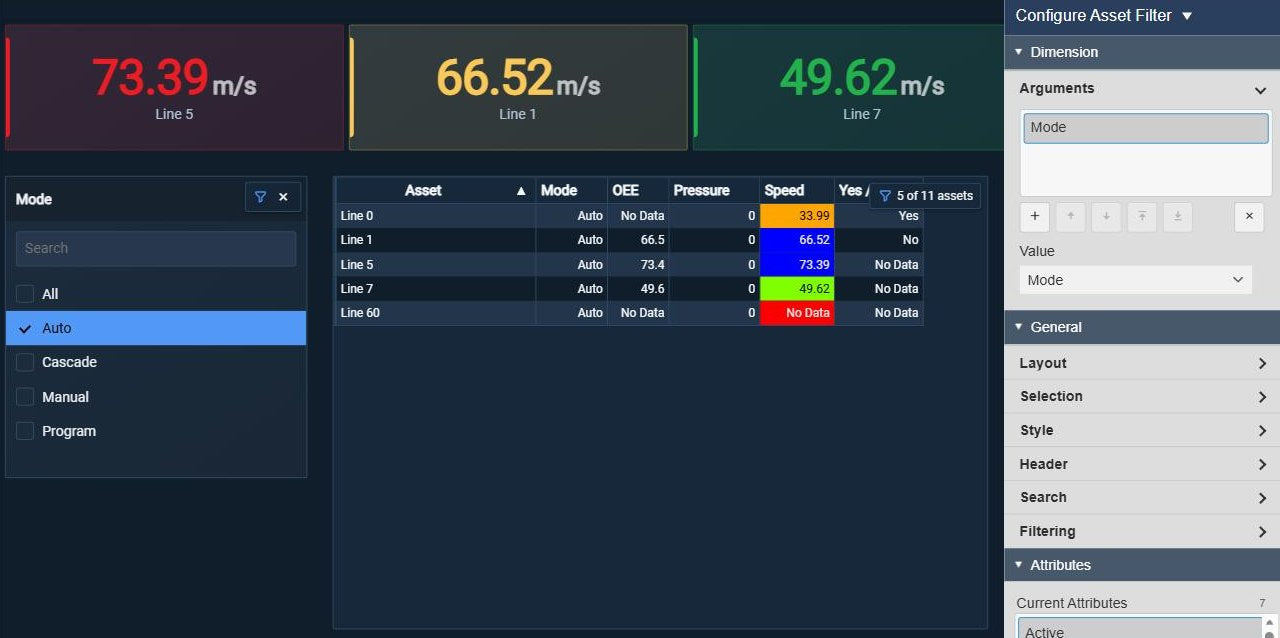
Asset Filter+ in PI Vision listing the operating modes of eleven production lines with Auto selected, beside Asset Comparison Table+ showing only the five lines in Auto mode with the indicator 5 of 11 assets, Asset Analytics KPI+ cards above, next to the Dimension settings with the argument Mode
Asset Filter+ v2.0 in PI Vision: one operating mode selected, the table and KPI cards narrowed to its lines. Demo data. Select the image to enlarge.

PI Vision asset filter for tables, charts and KPIs

Build one display for the whole fleet and let operators narrow it to the assets they care about, without editing the display.

One selection narrows the other asset symbols

Select a value in Asset Filter+ and the compatible symbols on the display show only the matching assets.

  • Works with Asset Comparison Table+, Asset Comparison Bar Chart+, Asset Time Series Chart+, Asset Analytics KPI+, Asset Treemap+, Radar Chart+, Map+ and Asset Select+.
  • Filtered symbols show a count such as "5 of 11 assets", so a filtered view is never mistaken for the whole fleet.
  • Clear the selection to show every asset again; other filters on the display stay active.
  • The display keeps its asset context; only the assets inside the symbols change.
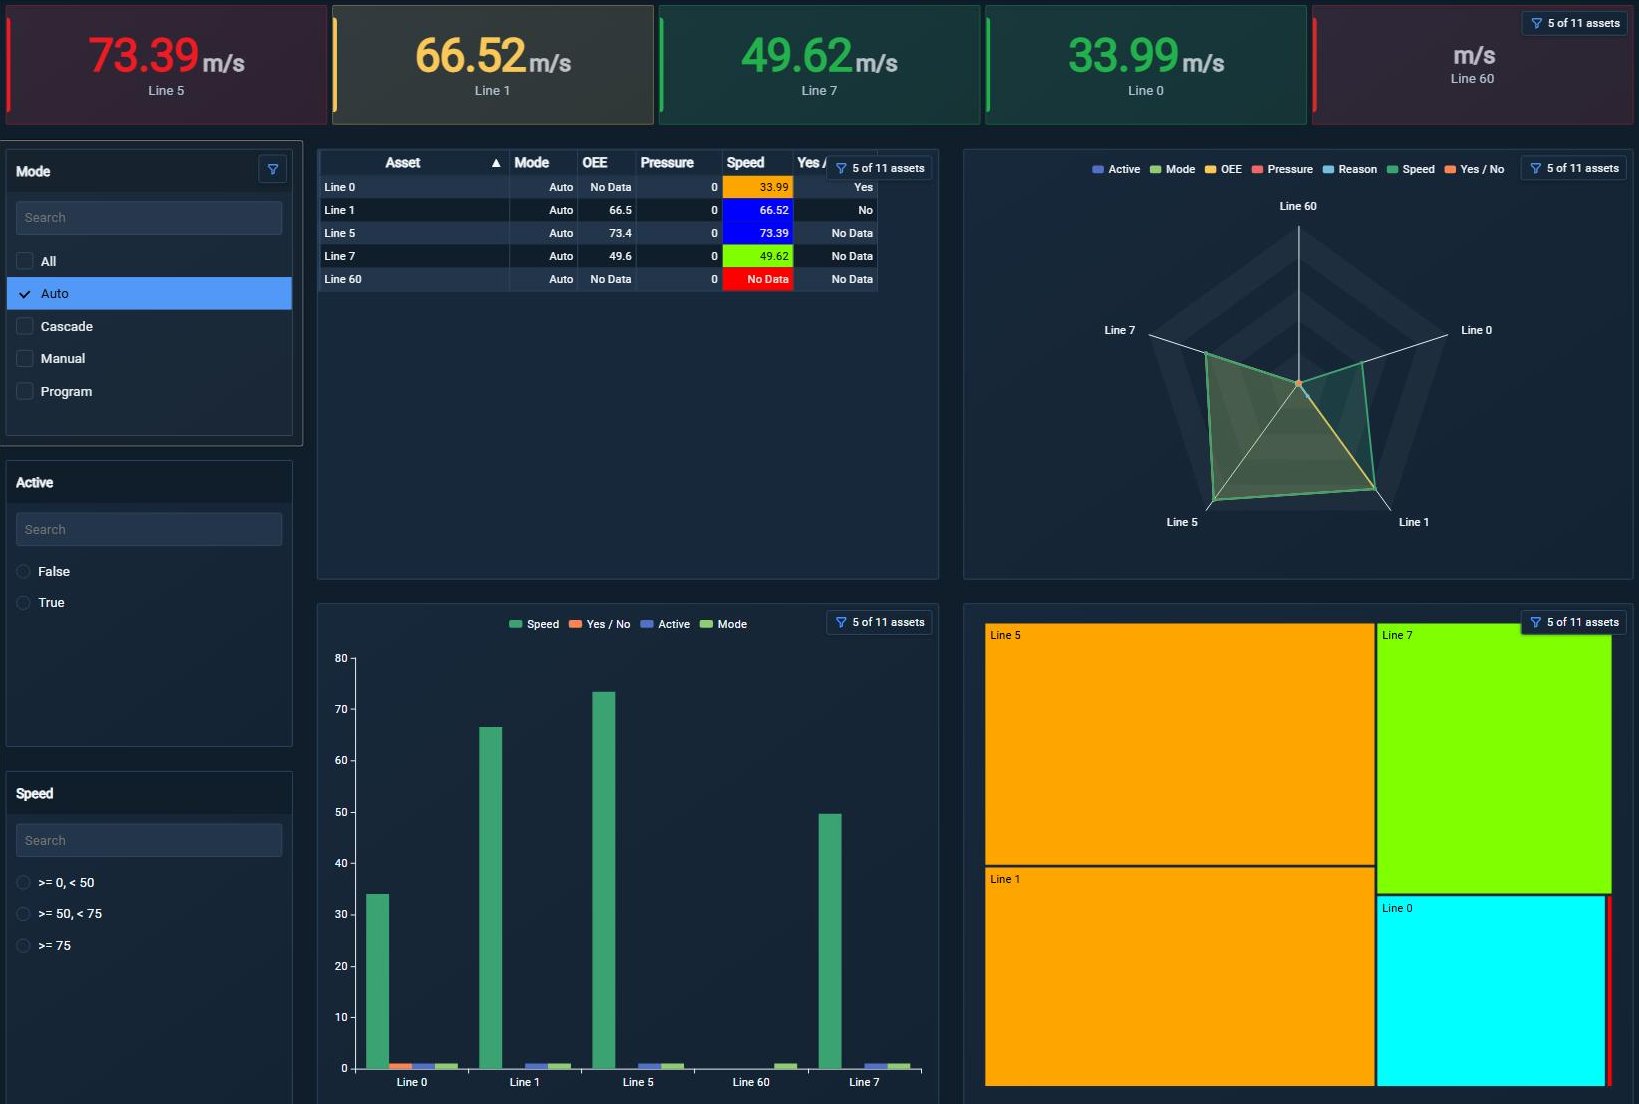
A PI Vision display with Asset Filter+ set to the operating mode Auto, and Asset Analytics KPI+ cards, Asset Comparison Table+, Radar Chart+, Asset Comparison Bar Chart+ and Asset Treemap+ each showing only the five lines in Auto mode with the indicator 5 of 11 assets
One selection narrows the KPI cards, table, radar chart, bar chart and treemap on the same display. Demo data. Select the image to enlarge.

Filter choices from any AF attribute or asset property

Use the attribute your teams already think in, and let an AF search fill the asset set so new assets appear without editing the display.

  • Choices from an AF attribute, or from the asset name, path, description or template.
  • Assets from a fixed selection or a PI Vision AF search.
  • Numeric attributes as current values or as summaries such as the time-weighted average over the display time range.
  • A search field narrows a long list without changing the filter definition.
Asset Filter+ with
The search field narrows the list; numeric attributes can be read as summaries. Demo data. Select the image to enlarge.

Asset lists, hierarchy trees and numeric ranges

Present the choices in the form that fits the question: a flat list, a hierarchy or ranges of a numeric value.

Single or multiple selection in a list or tree

Let operators focus on one group, or compare several groups side by side.

  • Single selection that can be kept from ever being empty, or multiple selection with All to restore the full set.
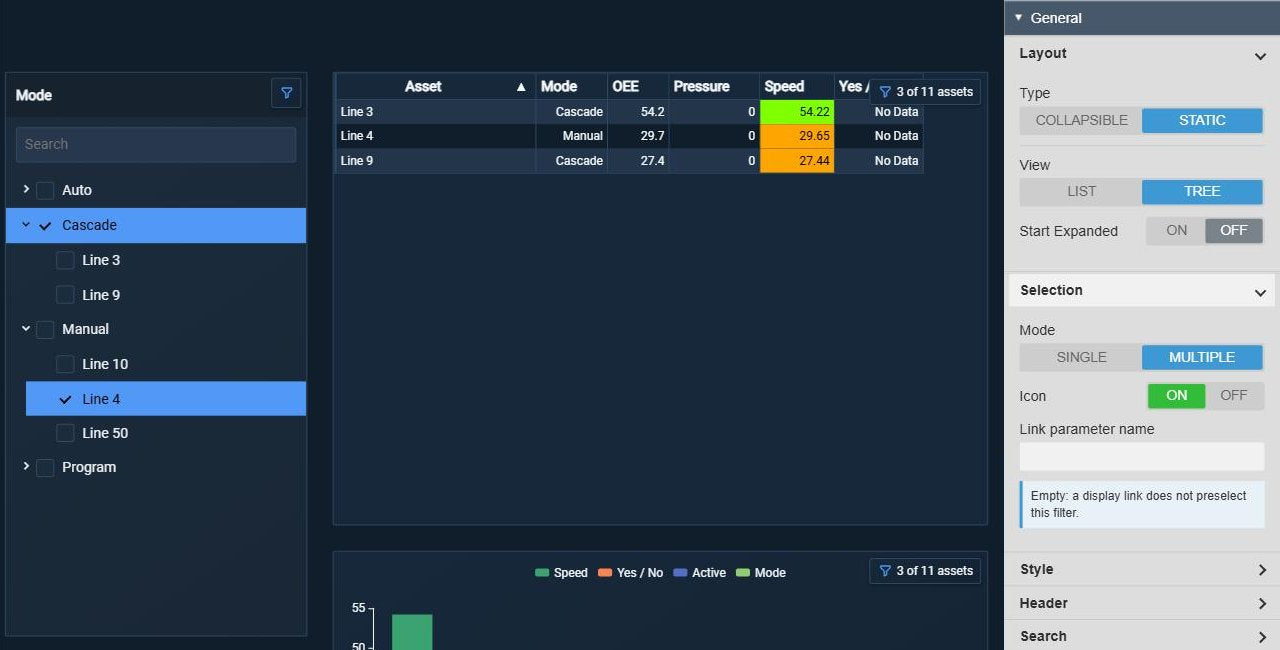
  • Several arguments, such as operating mode and asset name, form a path shown as an expandable tree.
  • Selecting a branch of the tree filters every asset below it.
  • A link parameter name lets a PI Vision display link preselect the filter.
Asset Filter+ as a tree with operating modes as branches and production lines below, with the whole Cascade branch and the single line Line 4 selected, beside Asset Comparison Table+ showing Line 3, Line 4 and Line 9 with 3 of 11 assets, next to the Layout settings with View Tree and the Selection settings with Mode Multiple, Icon and Link parameter name
Tree view from two arguments: a whole branch and one line selected. Demo data. Select the image to enlarge.

Numeric ranges for speed, flow or temperature

Group a numeric attribute into bands you define, instead of one entry per value.

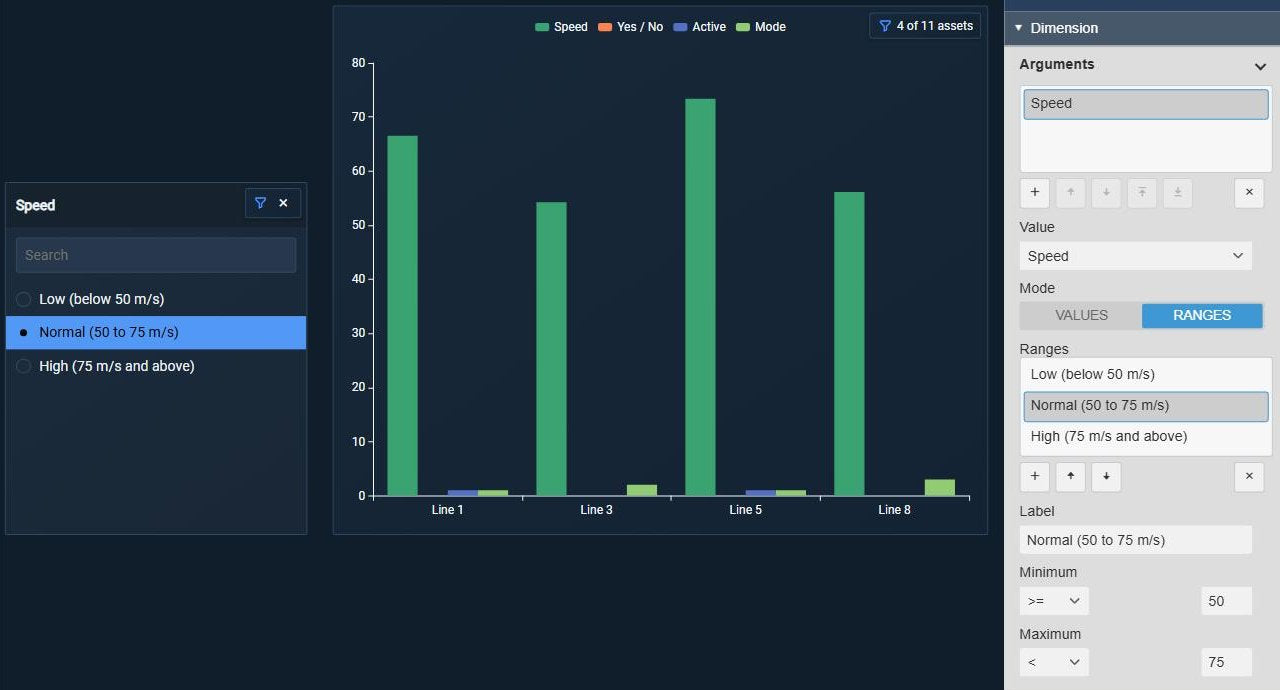
  • Ranges with a label and a lower and upper limit, inclusive or exclusive.
  • Invalid ranges are marked in the configuration pane and left out of the list.
  • Selecting a range narrows the other asset symbols to the assets inside it.
  • Ranges publish a Master filter; lists and trees can also publish linked channels.
Asset Filter+ listing three speed ranges, Low, Normal and High, with Normal (50 to 75 m/s) selected, beside Asset Comparison Bar Chart+ showing the four lines in that range with 4 of 11 assets, next to the Dimension settings with Mode Ranges, the list of ranges and the label, minimum and maximum of the selected range
Line speed grouped into three labelled ranges defined in the pane. Demo data. Select the image to enlarge.

Combine PI Vision filters and link assets to events

Layer several filters on one display, pass the selected assets to Event Frame symbols, and fit the filter into the display.

Several filters and linked channels

Combine filters such as operating mode and speed range, and connect asset selections to other symbols through named channels.

  • Several Asset Filter+ symbols on one display: assets must match every active filter.
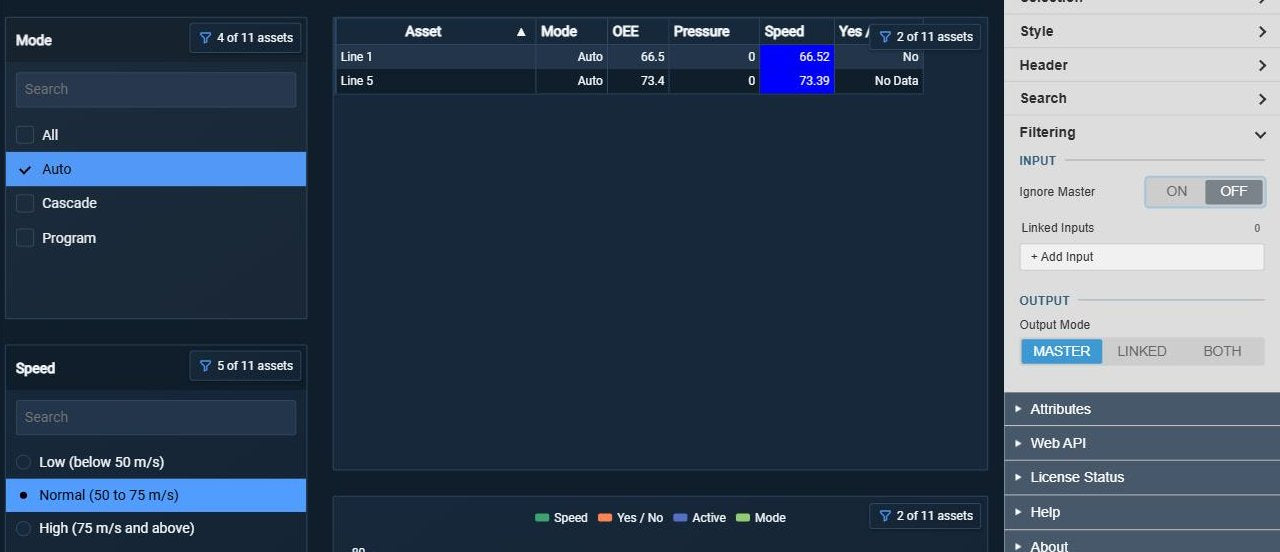
  • Turn Ignore Master off and a filter shows how many assets the other filters leave; a value list offers only those values.
  • Output Mode Master, Linked or Both, and linked inputs from other symbols.
  • A linked channel can pass the selected asset paths to Events Table+ to show those assets’ events.
Two Asset Filter+ symbols, operating mode with Auto selected and speed ranges with Normal selected, narrowing Asset Comparison Table+ to Line 1 and Line 5 with the indicator 2 of 11 assets; the mode filter lists only the modes left by the speed filter, and each filter shows its own count, next to the Filtering settings with Ignore Master Off and Output Mode Master, Linked and Both
Two filters combined: only lines in Auto mode with a normal speed remain. Demo data. Select the image to enlarge.

Collapsible filter panel, header and themes

Keep the filter as small as the display needs and match it to the rest of the dashboard.

  • A static list, or a collapsible header that opens on click, closes on select and can start expanded.
  • Header with your own title or the current selection.
  • Theme presets with surface and container styles, or custom background and text colours, font, font size and padding.
  • Radio buttons and checkboxes that follow the theme, or plain rows.
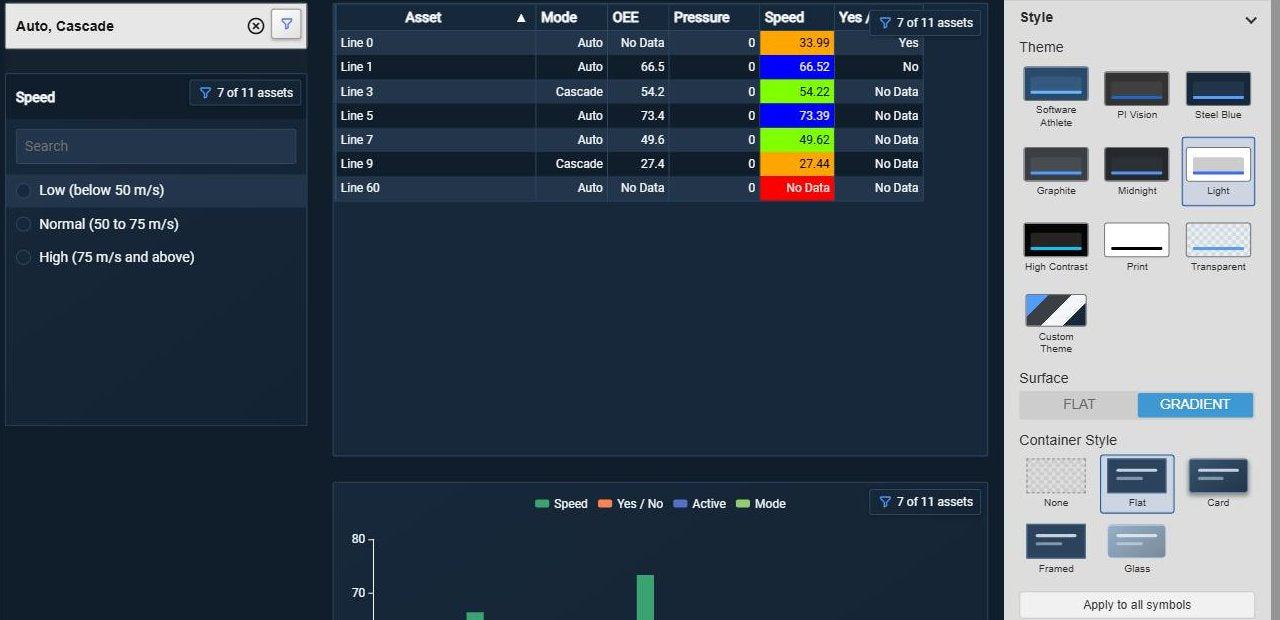
Asset Filter+ collapsed to a single header in the Light theme showing the selection Auto, Cascade, above a second filter for speed ranges and beside Asset Comparison Table+ with 7 of 11 assets, next to the Style settings with the theme presets, Surface and Container Style
Collapsed filter in the Light theme, with the selection in the header. Demo data. Select the image to enlarge.

PI Vision asset filter examples

Four common ways teams use Asset Filter+ on their displays.

Lines by operating mode

Data
Production lines from an AF search, with an operating mode attribute
Settings
Argument Mode, multiple selection, Asset Comparison Table+ and KPI cards beside it
Shows
The lines in the selected modes, with "5 of 11 assets" on every narrowed symbol

Compare production areas

Data
An area or line attribute on every asset
Settings
Multiple selection, Asset Comparison Bar Chart+ beside it
Shows
One area, or a chosen group of areas, compared without editing the display

Speed, flow or load bands

Data
A numeric speed, flow or load attribute
Settings
Numeric ranges such as low, normal and high, Asset Analytics KPI+ beside it
Shows
Fleet KPIs recalculated for the assets in the selected band

Events of the selected assets

Data
An AF search and an Event Frame search on the same assets
Settings
Linked output AssetPath to Events Table+, target property Asset
Shows
The events of exactly the assets selected in the filter

Asset Filter+ FAQ

Questions we are asked most often. Read the Asset Filter+ documentation or ask a technical question.

How is Asset Filter+ different from Asset Select+?

Asset Filter+ narrows the set of assets shown inside compatible Vision Library+ symbols and leaves the display’s asset context unchanged, so a table or chart can show one group of assets or several. Asset Select+ changes the PI Vision asset context, so the whole display switches to one selected asset. Use Asset Select+ when the goal is to change the asset context, and Asset Filter+ to filter an existing asset collection. Asset Filter+ can also narrow the Asset Select+ list.

Which symbols follow the filter?

Asset Comparison Table+, Asset Comparison Bar Chart+, Asset Time Series Chart+, Asset Analytics KPI+, Asset Treemap+, Radar Chart+, Map+ and Asset Select+ follow its Master filter. Event Frame symbols such as Events Table+ can follow a selection through a linked channel. Native PI Vision symbols are not filtered.

Why does a symbol not change when we select a value?

The target symbol must take part in asset filtering and use the same asset collection. Filtering applies to the assets a symbol has already loaded; it does not run a new search, so each symbol’s own search, time range and result limit must include every asset the filter can select. Also check that the symbol does not have Ignore Master switched on.

Can we combine several filters on one display?

Yes. Place several Asset Filter+ symbols, for example one for the operating mode and one for a speed range; the other symbols then show only the assets that match every active filter. Turn Ignore Master off on a filter to see how many assets the other filters leave and, in a value list, to offer only those values.

What do we need to run it?

PI Vision 2021 or later with PI Web API, and PI AF Server 2018 SP2 or later. Asset Filter+ runs in PI Vision and uses each user’s existing PI permissions.

How do we get Asset Filter+?

Asset Filter+ is part of Vision Library+, together with the other Vision Library+ symbols. Request a trial to test it in your own PI Vision environment.

Try Asset Filter+ in your PI Vision

Asset Filter+ is included in Vision Library+, the PI Vision custom symbol library from Software Athlete. Test it on your own displays and data.