Combo Chart+ for AVEVA PI Vision

PI Vision combo chart for trends, limits and statistics

Put lines, bars, areas and scatter traces on one PI Vision trend, each on the scale it needs, and read limits, equipment states and server statistics on the same chart.

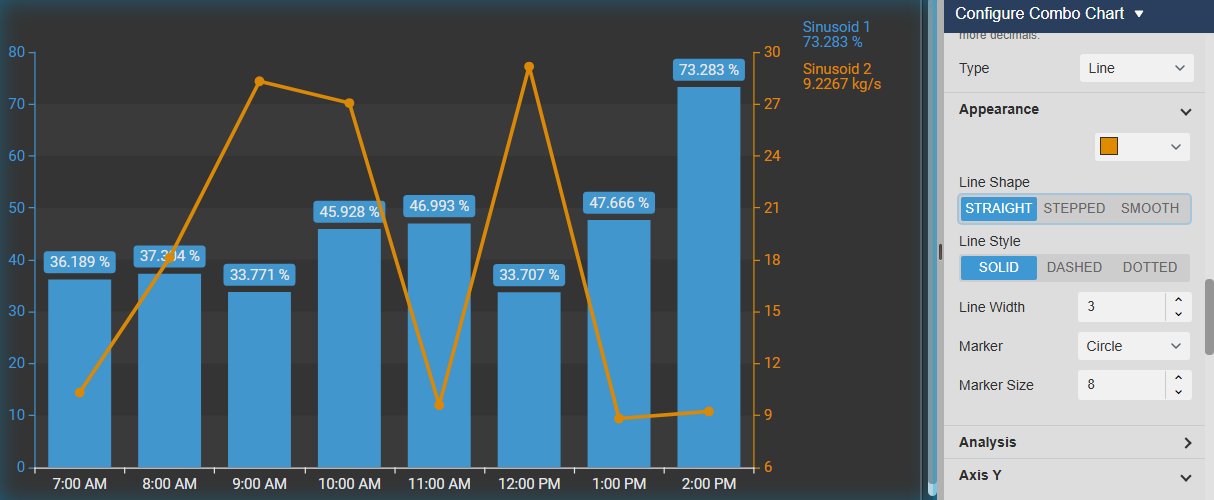
Combo Chart+ in PI Vision showing hourly bars of one tag and a line with circle markers for a second tag on its own right-hand scale, next to the Trace Options settings for trace type, line shape, line style, width and marker
Combo Chart+ v2.0 in PI Vision: hourly bars and a line on two value scales, next to the Trace Options settings. Demo data. Select the image to enlarge.

Line, bar, area and scatter traces in one PI Vision trend

Choose a trace type for each data source and a scale arrangement for the chart, so values with different units stay readable side by side.

Bars, lines, areas and stacks on one time axis

Draw a production rate as hourly bars, a process value as a line and a boundary pair as a shaded band, all on the same timeline.

  • Line, Area, Bar, Scatter or Range Area per data source.
  • Straight, stepped or smooth lines, solid, dashed or dotted, with optional markers.
  • Stacking Off, Normal or 100% per scale, with bars only or with lines and areas.
  • Default, Summary, Recorded or Interpolated data, for example one bar per hour.
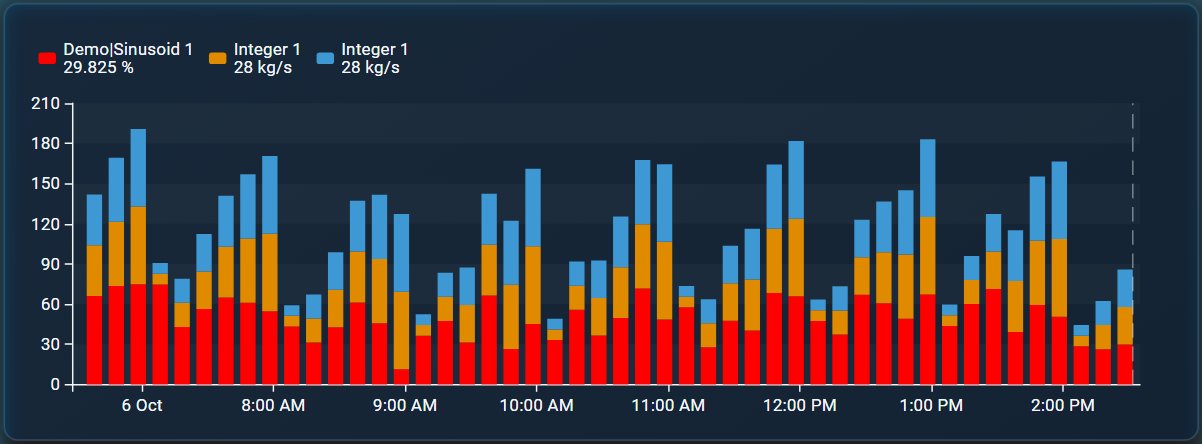
Combo Chart+ with three data sources stacked as bars for each interval over eight hours, with a legend showing current values
Three data sources stacked as bars for each interval. Demo data. Select the image to enlarge.

Single, multiple, separate or custom scales

Keep percentages, flows and areas readable together instead of squeezing them onto one axis.

  • Single: one shared scale. Multiple: one scale per data source.
  • Separate: one plot per trace on a shared time axis.
  • Custom: named scales for groups of related sources.
  • Linear or logarithmic, with an automatic, database or custom range.
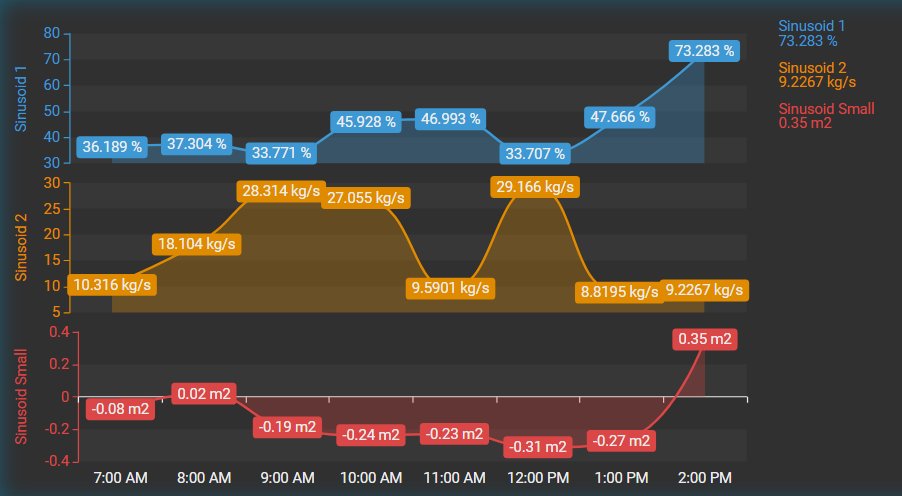
Combo Chart+ in Separate scale mode with three plots sharing one time axis, each with its own scale, area trace and value labels
Separate mode: three traces, three plots, one time axis. Demo data. Select the image to enlarge.

Operating limits, targets and equipment states on the trend

See at a glance when a value left its operating window, and what the equipment was doing at the time.

Colour the trend by its limits

Add a PI Vision multi-state and Combo Chart+ colours the trace and its labels by the state each value falls in.

  • Colours lines, markers, bars, areas and range-area bands.
  • Data labels can follow the state colour independently.
  • Historical state ranges as shaded background bands.
  • Colours come from the native PI Vision multi-state editor.
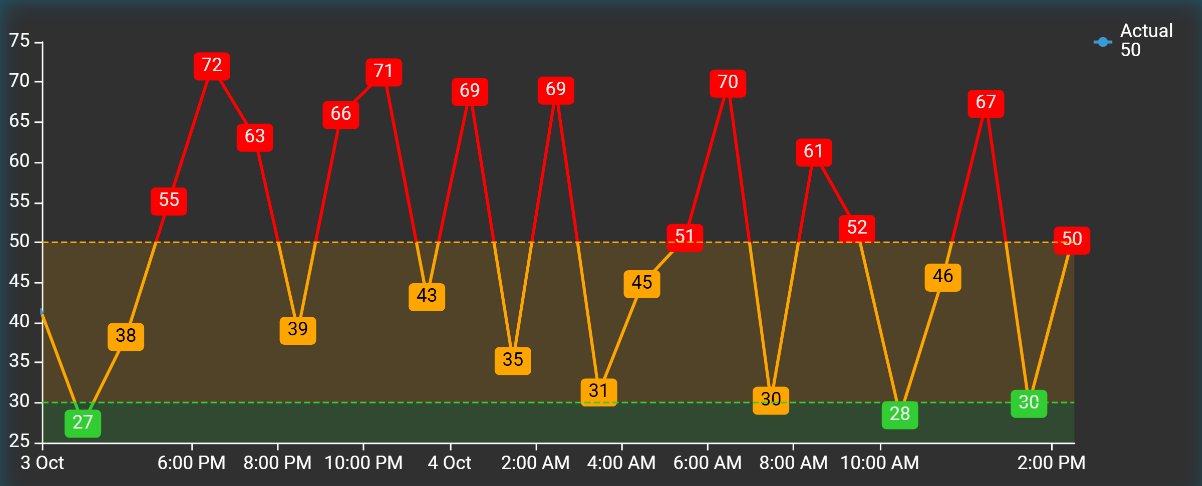
Combo Chart+ line trace coloured red, orange or green by multi-state limits, with matching coloured value labels and shaded state bands
Trace and labels coloured by multi-state limits, with state bands. Demo data. Select the image to enlarge.

Historical limits and AF targets

Show the limits and the target that applied at each moment, read from their AF history, as dashed lines with labels.

  • Limit lines in the state colours or the series colour.
  • Target line from the AF target history.
  • Labels on limits, bands and target.
  • For SPC-style charts, show control limits that your AF analyses calculate and historize.
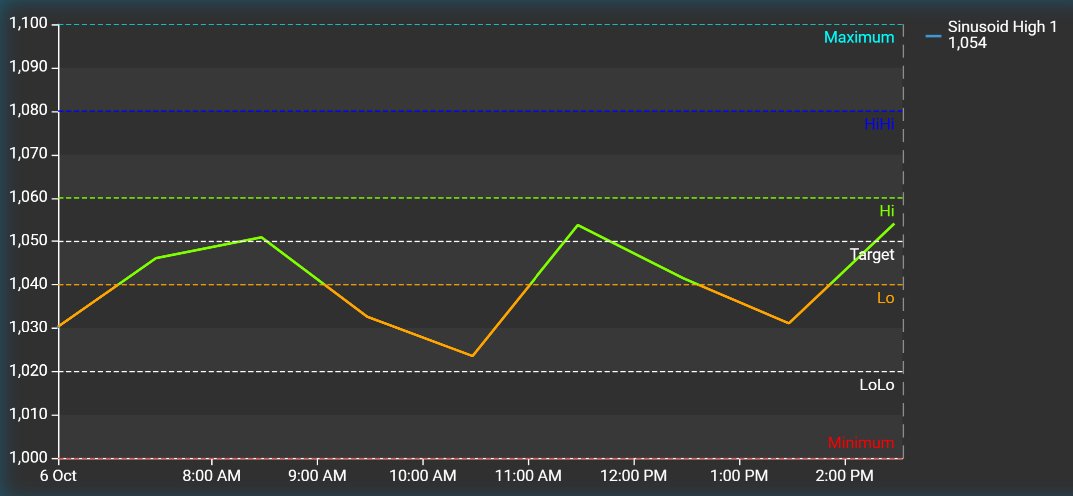
Combo Chart+ with a process value between dashed limit lines labelled Minimum, LoLo, Lo, Target, Hi, HiHi and Maximum, coloured by the limit it is in
Limit and target lines from AF with labels. Demo data. Select the image to enlarge.

Equipment states as bands or a stepped trend

Put a digital, enumeration or Boolean tag next to the measurements to see which state the equipment was in.

  • Bands: shaded state intervals with transition lines and labels.
  • Trend: a stepped line with the state names on its scale.
  • State names in the legend, tooltip and ruler readouts.
  • String tags appear as time markers with text labels.
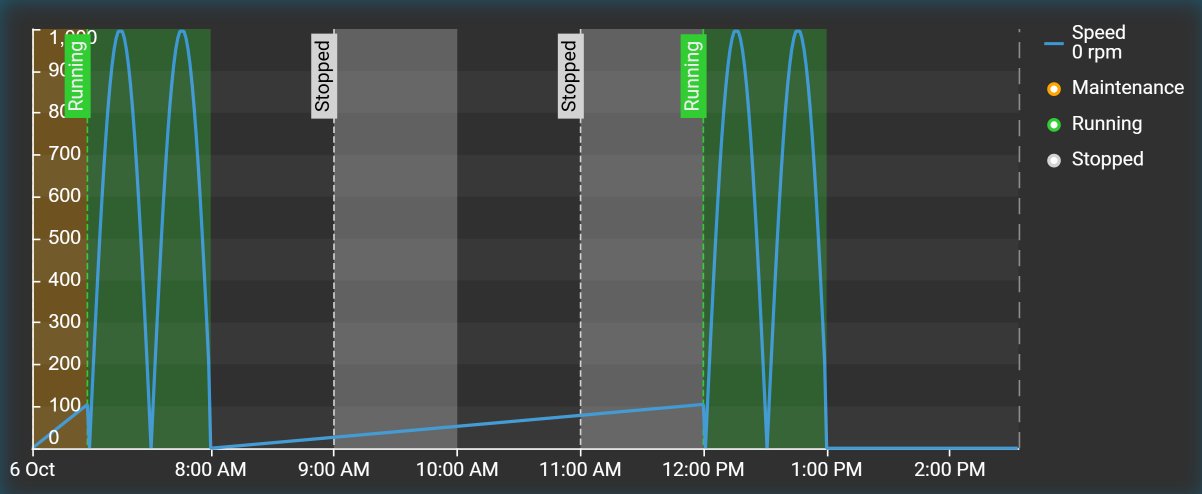
Combo Chart+ showing a speed trend over shaded Running, Stopped and Maintenance bands from a digital state tag, with state labels and a legend
Running, Stopped and Maintenance bands behind a speed trend. Demo data. Select the image to enlarge.

Rulers, summary statistics and trend analysis

Investigate a period without leaving the display: place rulers, compare server statistics and add a trend line.

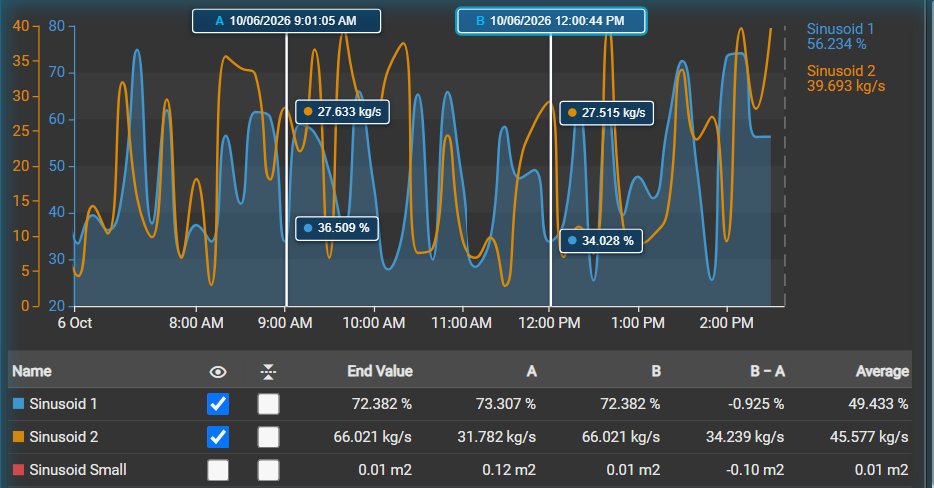
Summary table between rulers A and B

Click the plot to place rulers A and B. The table below the chart shows server statistics for that interval.

  • End value, average, min and max, plus standard deviation, range and event count.
  • Values at A and B and the B − A difference.
  • Drag to select a period without zooming or changing display time.
  • Per-row actions to show or hide a trace, or switch on regression, moving average or multi-state.
Combo Chart+ with rulers A and B placed on the trend and a summary table below listing end value, value at A and B, the B minus A difference and the average for each data source
Rulers A and B with the summary table for the interval between them. Demo data. Select the image to enlarge.

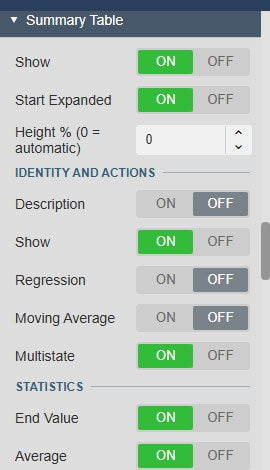
Choose the statistics you need

Set which columns the summary table shows, whether it opens expanded and how much of the chart it may use.

  • Columns grouped into identity and actions, statistics, and boundaries and differences.
  • Start expanded, with an automatic or fixed height.
  • Hover position and rulers can be synchronised with other charts on the display.
Combo Chart+ Summary Table settings with Show, Start Expanded, Height and the identity, action and statistics column switches
Summary Table settings. Select the image to enlarge.

Regression and moving average

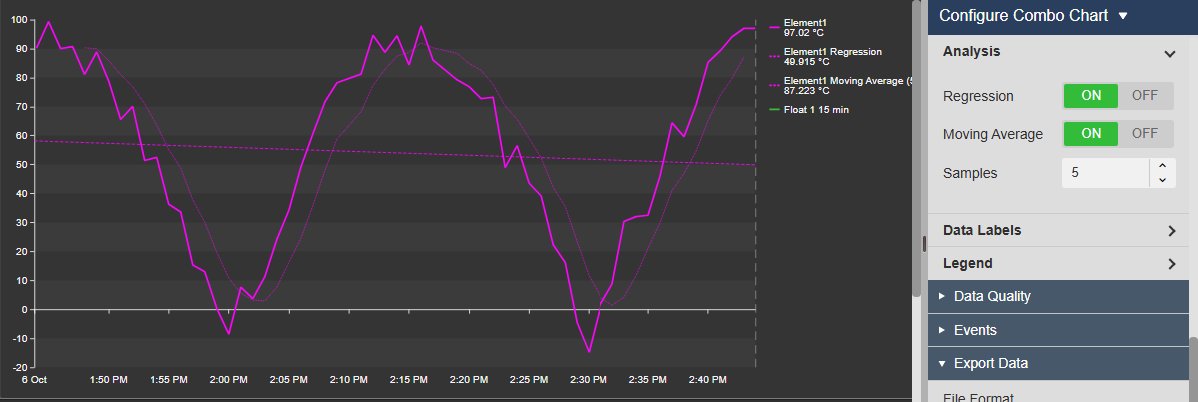
Add a linear best-fit line or a moving average to a numeric trace to see the direction behind noisy data.

  • Regression draws a dashed linear best-fit line.
  • Moving average over 1 to 100 samples, drawn dotted.
  • Both use the trace colour and get their own legend entry.
Combo Chart+ trend with a dashed regression line and a dotted moving average, next to the Analysis settings with Regression, Moving Average and Samples
Regression and a five-sample moving average with the Analysis settings. Demo data. Select the image to enlarge.

Event frames, zoom and export

Relate process changes to events, look closer at a period and take the data with you.

Event frames on the trend

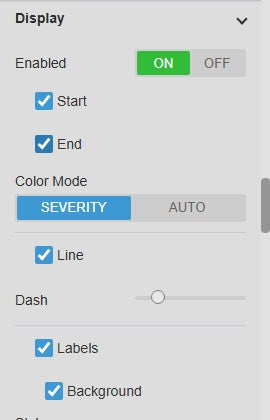
Show the event frames from an AF search over the trend, or create a new event frame from an interval you drag on the chart.

  • Start and end lines, labels and shaded regions, coloured by severity or automatically.
  • Click an event label to open its details, comments and attribute values.
  • Create an event frame in AF from a selected interval and a configured template.
Combo Chart+ Events settings with Display enabled, Start and End lines, Color Mode severity or auto, Line, Dash and Labels
Events display settings. Select the image to enlarge.

Toolbar, full screen and download

A toolbar on the chart handles zoom, full screen and downloads, and a zoom can drive the display time for every symbol.

  • Pan, box zoom, zoom in and out, reset and full screen.
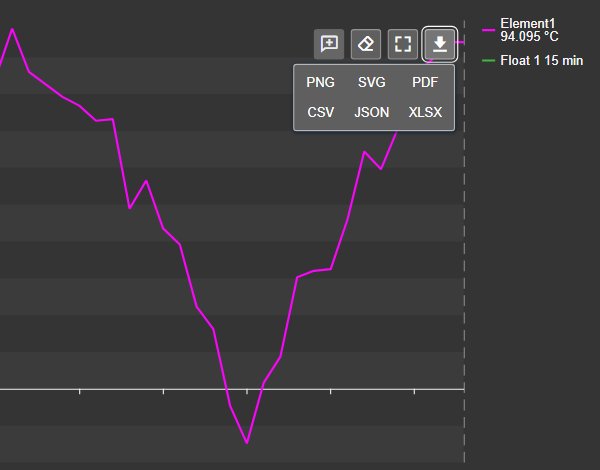
  • Download as PNG, SVG or PDF, or the samples as CSV, JSON or XLSX.
  • Apply a zoom to the display time, so an overview chart steers the others.
  • Built-in time bar, and a sparkline style for compact KPI trends.
Combo Chart+ toolbar with the download menu open, offering PNG, SVG, PDF, CSV, JSON and XLSX
Toolbar with the download menu. Demo data. Select the image to enlarge.

PI Vision combo chart examples

Four common ways teams use Combo Chart+ on their displays.

Production versus target

Data
Hourly production and its AF target
Settings
Summary mode, bar trace, multi-state target line
Shows
Which hours fell short of target

Process value with control limits

Data
A quality value with limits historized by your AF analyses
Settings
Line trace, multi-state colour series, bands and target
Shows
When and how long the process ran outside its limits

Speed and pressure on one chart

Data
Line speed and pressure of one production line
Settings
Line and area traces, multiple value scales, summary table
Shows
Averages and extremes per signal without mixing m/s and bar

Downtime context

Data
A process value and the equipment state tag
Settings
State bands, event frames on the trend
Shows
What the equipment was doing when the value changed

Combo Chart+ FAQ

Questions we are asked most often. Read the Combo Chart+ documentation or ask a technical question.

Which trace types can Combo Chart+ draw?

Line, area, bar, scatter and range area for numeric PI points and AF attributes, chosen per data source. Digital, enumeration and Boolean sources appear as state bands or a stepped state trend, and string sources as text markers on the time axis.

Can I show values with different units on one chart?

Yes. Use Multiple value scales for one scale per data source, Separate for one plot per trace on a shared time axis, or Custom to group related sources on named scales. The chart does not convert units, so sources that share a scale should use compatible units.

Can Combo Chart+ show SPC control limits?

Yes, if the limits are stored in AF. Combo Chart+ shows historical limits and targets as lines, bands and labels, and colours the trace by limit. Calculate and historize the control limits with your own AF analyses; the chart displays them but does not calculate them.

How does the summary table calculate its statistics?

The statistics are calculated on the server for the interval between rulers A and B, a selected interval, or the chart’s time range. New tables use time-weighted statistics, so they can differ from the hover and ruler values, which come from the plotted samples.

What do we need to run it?

PI Vision 2021 or later with PI Web API, and PI AF Server 2018 SP2 or later. Combo Chart+ runs in PI Vision and uses each user’s existing PI permissions. Creating event frames also needs write access to the AF database.

How do we get Combo Chart+?

Combo Chart+ is part of Vision Library+, together with the other Vision Library+ symbols. Request a trial to test it in your own PI Vision environment.

Try Combo Chart+ in your PI Vision

Combo Chart+ is included in Vision Library+, the PI Vision custom symbol library from Software Athlete. Test it on your own displays and data.