AF Table+ for AVEVA PI Vision

PI Vision AF table with filters, SQL parameters and editing

Bring the rows of an AF table into your PI Vision display: a reference list stored in AF, a linked CSV file or the result of a SQL query. AF Table+ filters the rows by display time or live attribute values, colours them by state and can let users edit static tables.

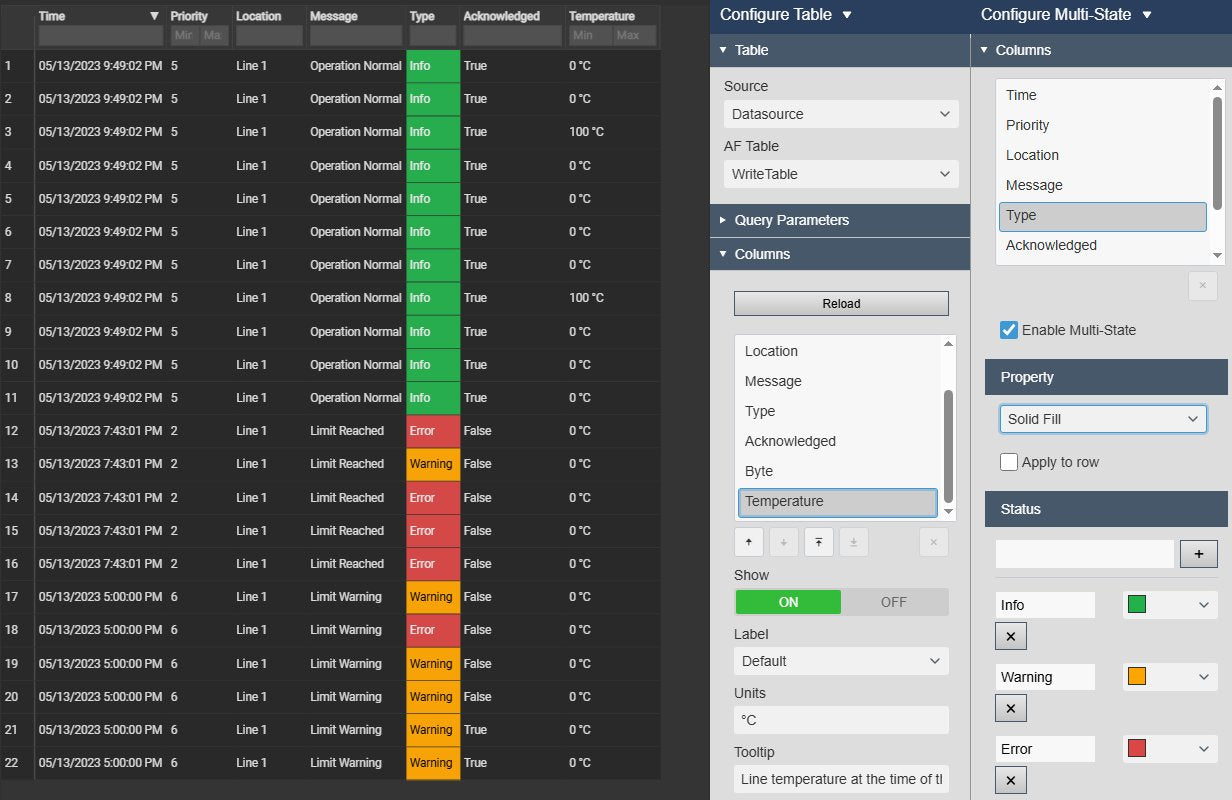
AF Table+ in PI Vision showing the rows of an AF table with a column filter row, units on the temperature column and multi-state colours on the Type column for Info, Warning and Error, next to the Table and Columns settings with the AF table, units and tooltip, and the multi-state settings with the states and their colours
AF Table+ v2.0 in PI Vision: the rows of an AF table with column filters, units and multi-state colours, next to its settings. Demo data. Select the image to enlarge.

Show AF tables in PI Vision

Display reference and configuration records next to your process data, without switching to PI System Explorer or another application.

Static, CSV-linked and SQL-linked AF tables

Show any table from the AF database library, whether its rows are stored in AF, read from a CSV file or returned by a SQL query.

  • Choose the AF table directly, or take it from the AF database of the first data source.
  • Per column: show or hide, your own label, units, a tooltip, alignment and number format.
  • Column widths that fit the data, fit the table width or are set by hand, with paging or continuous scrolling.
  • Wrapped text, right-to-left reading order, row numbers and automatic reload at an interval you choose.
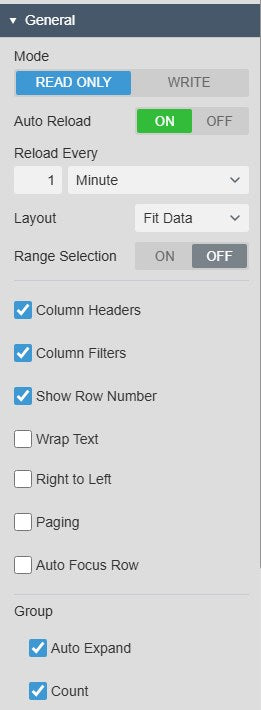
AF Table+ General settings with Mode Read Only or Write, Auto Reload with Reload Every 1 minute, Layout Fit Data, Range Selection, Column Headers, Column Filters, Show Row Number, Wrap Text, Right to Left, Paging, Auto Focus Row and the Group options Auto Expand and Count
General settings: layout, column headers and filters, row numbers, paging and automatic reload. Select the image to enlarge.

Multi-state colours, grouping and export

Let colours mark the rows that need attention, group long tables by a column, and give readers the rows in the format they need.

  • Multi-state colours per column from text states such as Info, Warning and Error, or from numeric thresholds.
  • Nine styles, from text colour, border and soft fill to status dot, value badge, solid fill and progress bars, on the cell or the whole row.
  • Rows grouped by a column, with a row count in each group header, expanded automatically or collapsed.
  • Export Data to CSV, JSON, Excel (XLSX) or PDF from the context menu.
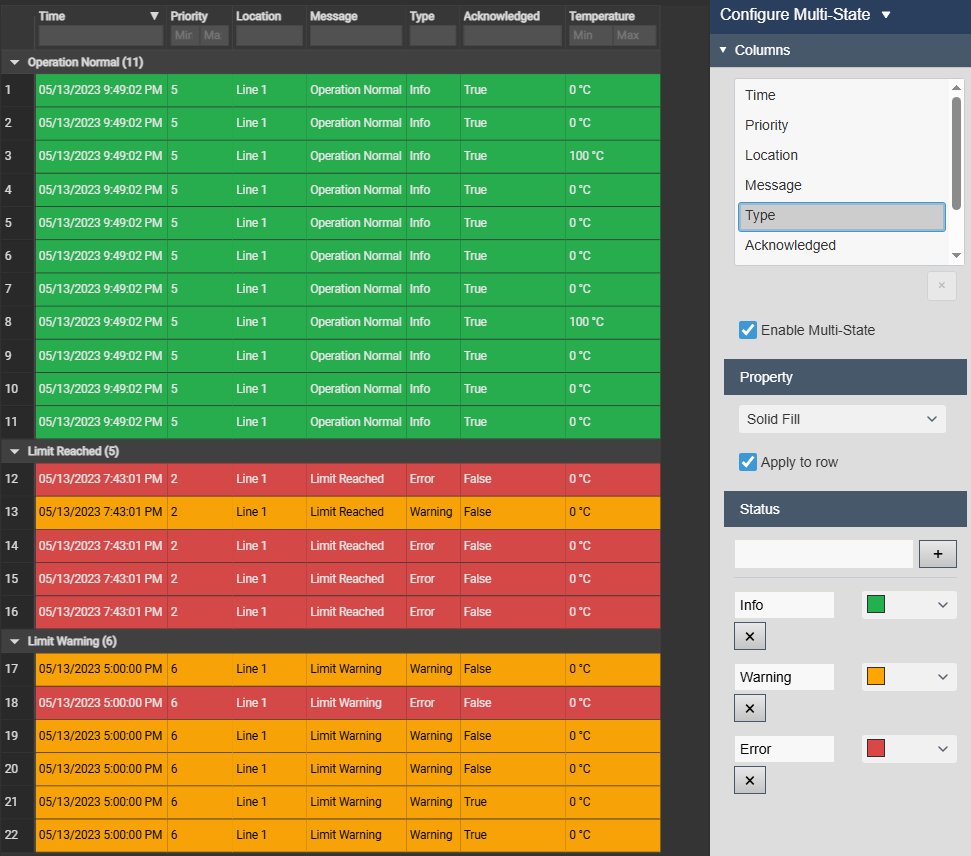
AF Table+ with rows grouped by message, each group header showing its row count, and every row filled green, amber or red by the multi-state of its Type column, next to the multi-state settings with Enable Multi-State, Property Solid Fill, Apply to row and the states Info, Warning and Error with their colours
Rows grouped by a column with row counts, coloured by multi-state with Apply to row. Demo data. Select the image to enlarge.

Filter AF table rows by display time and attribute values

Show only the rows that belong to the display period or to the asset the user is looking at.

Display time and attribute value filters

Tie the table to the display, so the rows follow the time range and the values on screen.

  • A DateTime column filters the rows to the display time range.
  • Basic conditions compare a column with a fixed value or with a data source value, such as an AF attribute: =, ≠, >, ≥, < or ≤.
  • Advanced expressions combine conditions with and/or and reference data sources as [1], [2].
  • Column filters in the header row: text for text columns, minimum and maximum for numbers.
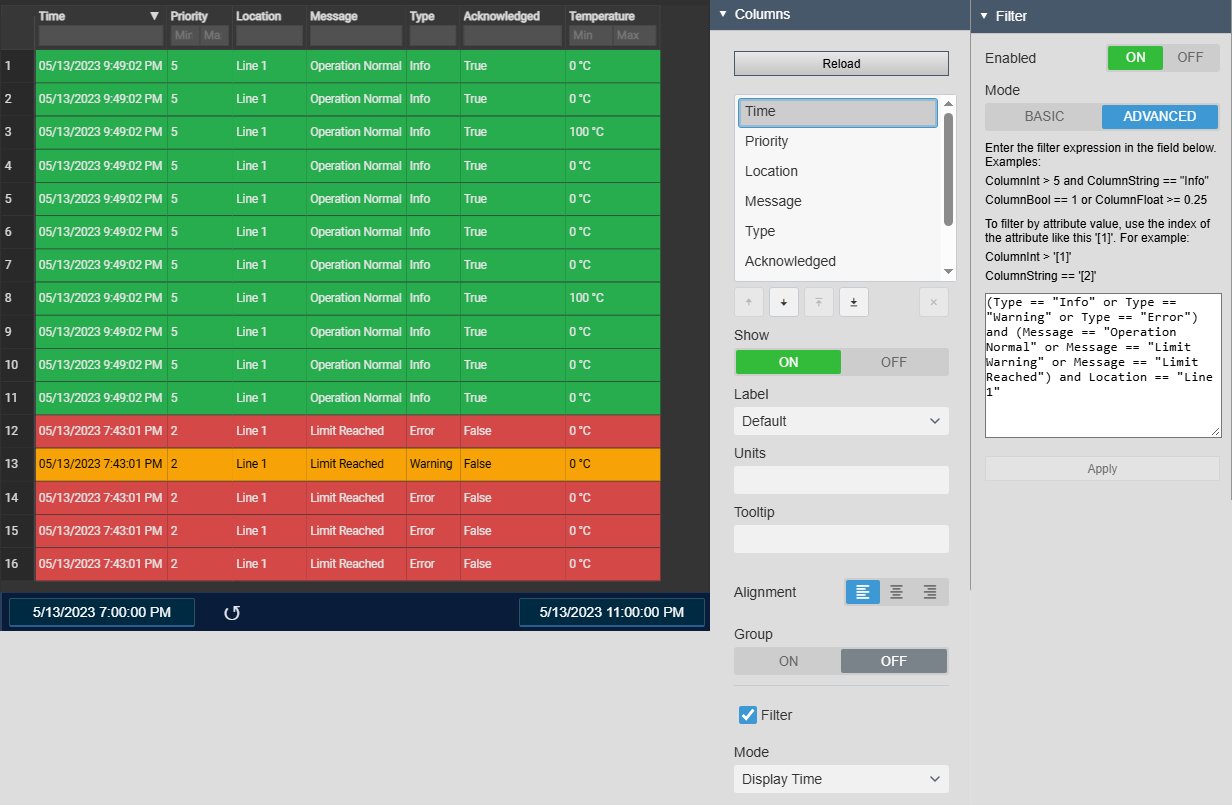
AF Table+ showing only the rows inside the display time range shown in the PI Vision time bar below it, next to the Columns settings of the Time column with Filter on and Mode Display Time, and the Filter settings with Enabled on, Mode Advanced and an expression that combines conditions on the Type, Message and Location columns
Rows limited to the display time range and narrowed by an advanced filter expression. Demo data. Select the image to enlarge.

Query parameters for SQL-linked tables

Filter a large SQL table on the database server, so only the rows the display needs reach the browser.

  • Display start time, display end time, a fixed value or a data source value passed to @ parameters of the linked table query.
  • The SQL query and its parameters stay in PI System Explorer; AF Table+ only supplies the values.
  • The current value of each parameter is shown in the settings.
  • Automatic reload at an interval from seconds to months, for SQL tables whose rows change.
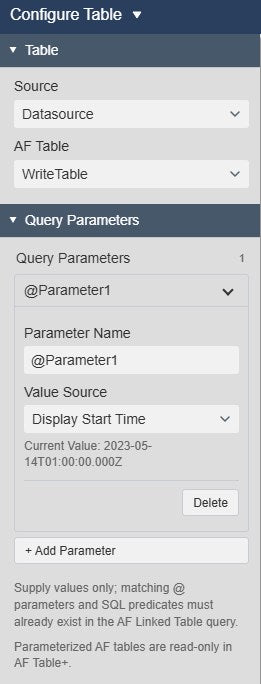
AF Table+ Table and Query Parameters settings with one parameter whose value source is Display Start Time, its current value, the Delete and Add Parameter buttons, and the notes that matching @ parameters must already exist in the AF linked table query and that parameterized AF tables are read-only
A query parameter that takes the display start time, with its current value. Select the image to enlarge.

Edit static AF tables from PI Vision

Maintain reference lists and configuration tables on the display where they are used.

Write mode with add, paste, import and undo

Switch a static AF table to Write mode and let users update its rows, then save the changes back to AF.

  • Edit cells, add rows and delete the ticked rows, with undo and redo before saving.
  • Paste a range of cells from Excel, import rows from a CSV file or export them to CSV.
  • Changes stay in the browser until Save, or Ctrl+S, writes the edited table back to AF.
  • Writes run through PI Web API as the signed-in user, so AF security decides who can change the table.
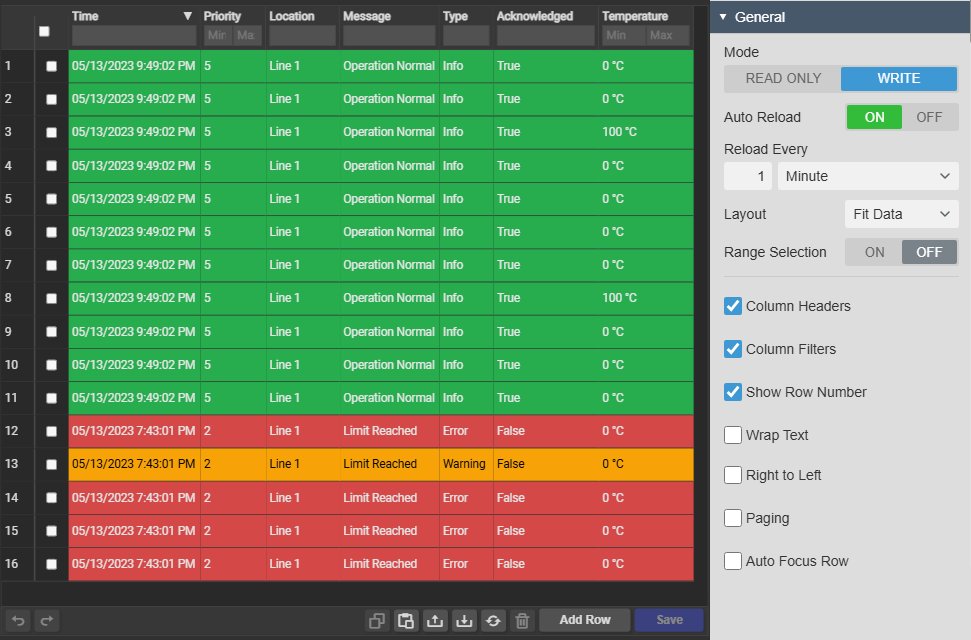
AF Table+ in Write mode with a tick box on every row and the edit toolbar with undo, redo, copy, paste, CSV import, CSV export, reload and delete buttons, Add Row and a Save button, next to the General settings with Mode set to Write
Write mode with row tick boxes and the edit toolbar; nothing was changed or saved. Demo data. Select the image to enlarge.

Editable columns and dropdown lists

Decide which columns users may change, and offer fixed choices where free text would cause errors.

  • Allow Edit per column, so key columns stay read-only.
  • Free text input, or a dropdown list of the values you define.
  • Editing is meant for static AF tables; tables with query parameters are always read-only.
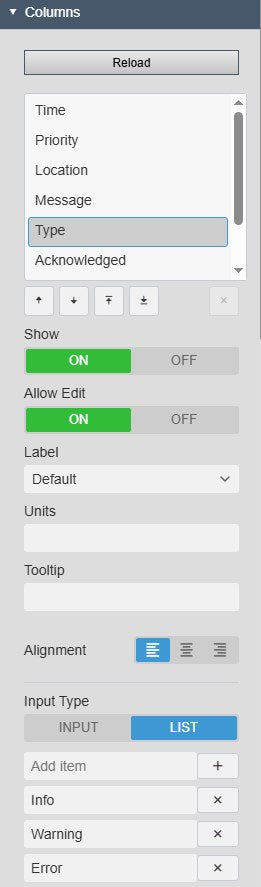
AF Table+ Columns settings in Write mode with the Type column selected, Show and Allow Edit on, Label, Units, Tooltip, Alignment and Input Type set to List with the items Info, Warning and Error
Allow Edit and a dropdown list of predefined values for one column. Select the image to enlarge.

PI Vision AF table examples

Four common ways teams use AF Table+ on their displays.

Production rows from SQL

Data
A SQL-linked AF table whose query has @StartTime and @EndTime parameters
Settings
Query parameters from Display Start Time and Display End Time, Auto Reload
Shows
Only the rows of the display period, filtered on the SQL server

Records for the current asset

Data
A static AF table with a column that matches an attribute of the displayed asset
Settings
Basic filter: that column equals the data source value
Shows
The rows that belong to the asset on screen

Editable reference list

Data
A static AF table of targets, limits or product settings
Settings
Write mode, Allow Edit on the value columns, dropdown lists for fixed choices
Shows
Engineers update the rows and save them to AF

Status list from a CSV file

Data
A CSV-linked AF table with a status column
Settings
Multi-state colours on the status column with Apply to row, grouping by status
Shows
Rows grouped and coloured by their status

AF Table+ FAQ

Questions we are asked most often. Read the AF Table+ documentation or ask a technical question.

Which AF tables can AF Table+ show?

Any table in the AF database library: static tables stored in AF, tables linked to a CSV file and tables linked to a SQL database. For SQL tables, use a database view or a query that returns only the rows the display needs. The SQL decimal type is not supported; cast decimal columns to float in the table link query.

When should we use AF Table+ instead of the other Vision Library+ tables?

Use AF Table+ for rows stored in an AF table: reference and configuration records, a linked CSV file or the result of a SQL query. Use Time Series Table+ for recorded or calculated values of PI Points and AF attributes over a time range. Use Alarm Table+ when rows should be created from limits or conditions on attributes, with acknowledgement and sound. Use Asset Comparison Table+ to show the same AF attributes for many AF assets, one row per asset.

Can users edit the table?

Yes, for static AF tables. Set the Mode to Write and turn on Allow Edit for the columns users may change, with free text or a dropdown list. Users can edit cells, add and delete rows, paste from Excel or import a CSV file, and Save writes the table back to AF. Tables with query parameters are always read-only, and linked CSV or SQL tables are not meant for editing. Writes use each user’s existing AF permissions.

Does AF Table+ load the whole SQL table?

Without query parameters, the linked table returns every row of its query, and the display time, attribute and column filters then work in the browser. With query parameters, AF Table+ passes values such as the display start and end time to @ parameters that already exist in the linked table query, so the SQL server filters the rows first. Check that your PI Web API version supports parameters for Table GetData.

What do we need to run it?

PI Vision 2021 or later with PI Web API, and PI AF Server 2018 SP2 or later. The AF tables are created in PI System Explorer. To edit static tables, PI Web API must allow writes and users need write permission in AF.

How do we get AF Table+?

AF Table+ is part of Vision Library+, together with the other Vision Library+ symbols. Request a trial to test it in your own PI Vision environment.

Try AF Table+ in your PI Vision

AF Table+ is included in Vision Library+, the PI Vision custom symbol library from Software Athlete. Test it on your own displays and data.