Events Table+ for AVEVA PI Vision

PI Vision event frame table to review and edit events

Give operators one table for their Event Frames: filter, group and total the events PI Vision finds, correct or create events, and open each event’s details without leaving the display.

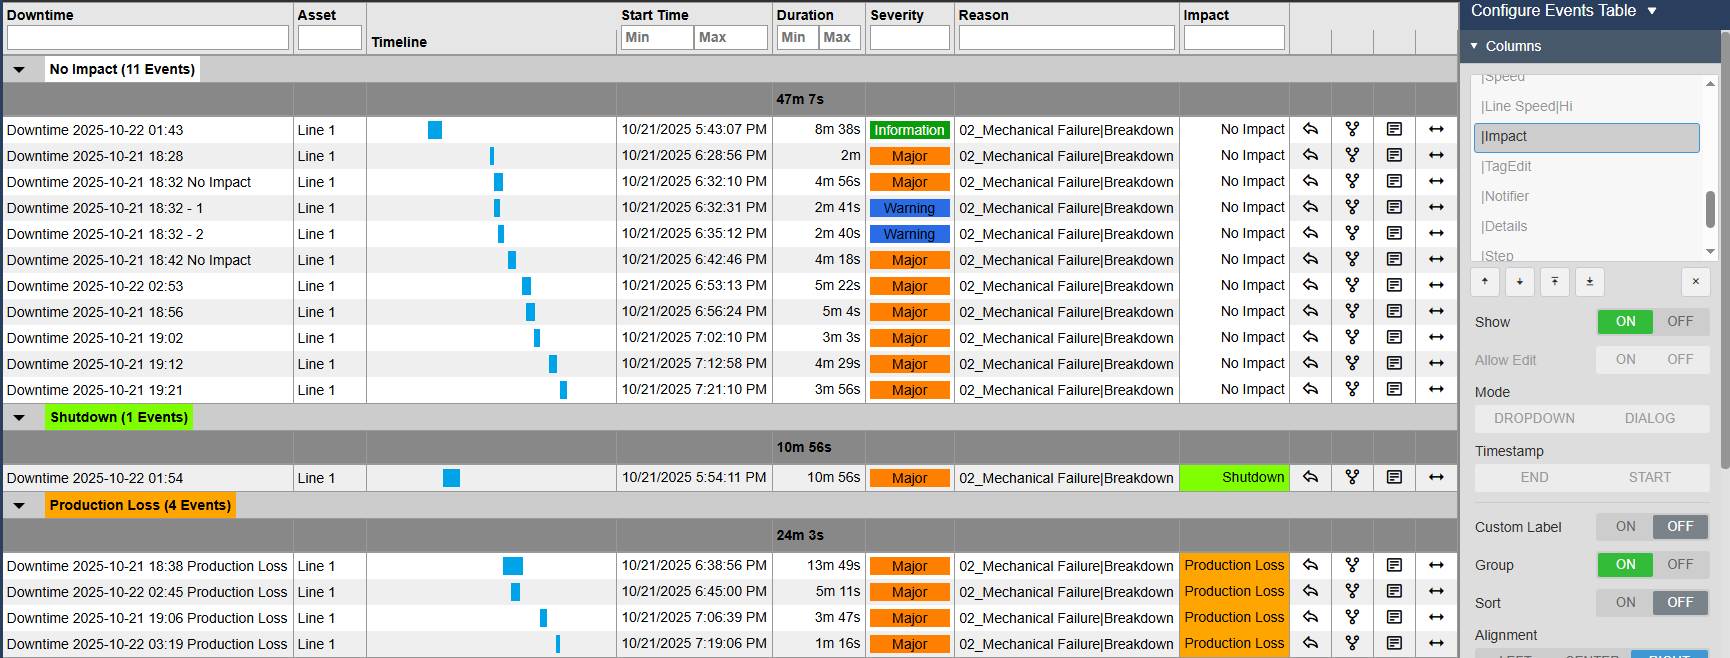
Events Table+ in AVEVA PI Vision listing downtime Event Frames grouped by impact with event counts, a timeline bar per event, start time, duration totals, colour-coded severity, reason and quick action buttons in each row, next to the Configure Events Table pane with the Impact column set to Group
Downtime events grouped by impact, with a timeline column, duration totals and quick actions per row. Demo data. Select the image to enlarge.

PI Vision event frame table with filters, groups and totals

Events Table+ lists the Event Frames of the PI Vision event search, with the event properties and attributes your team needs as columns.

Event Frames and their attributes as columns

Show exactly the event information operators work with, from start and end time to the attributes of the event template.

  • Event properties such as name, description, asset, start and end time, duration, severity and reason, plus Event Frame attributes with units.
  • A timeline column that shows when each event happened and how long it lasted, and a comments column.
  • Child event frames as a tree or a flat list, expanded automatically if you like.
  • Multi-state colours on attribute values, custom column labels, alignment and column order.
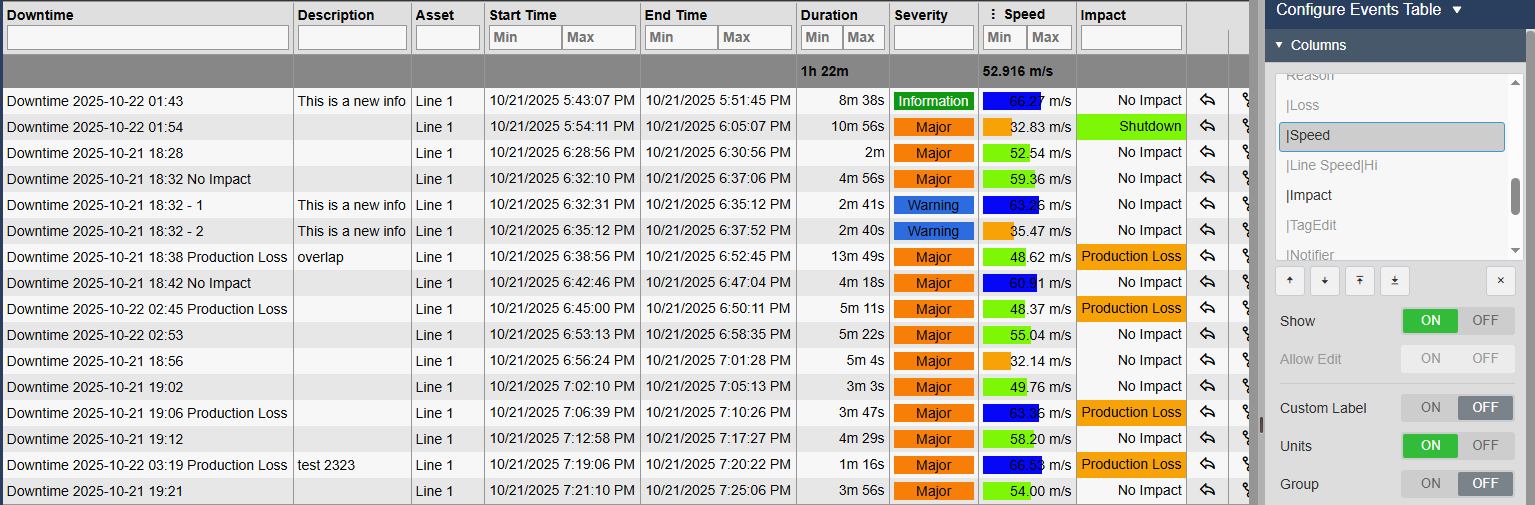
Events Table+ with columns for event name, description, asset, start time, end time, duration, severity, a Speed attribute with units and multi-state colours, and impact, with the top totals row and the Configure Events Table pane showing the Speed column settings Show, Allow Edit, Custom Label, Units and Group
Event properties and attributes as columns, with units, multi-state colours and a totals row. Demo data. Select the image to enlarge.

Filter, group, total and export events

Find the events that matter in seconds and hand the result on without copying data by hand.

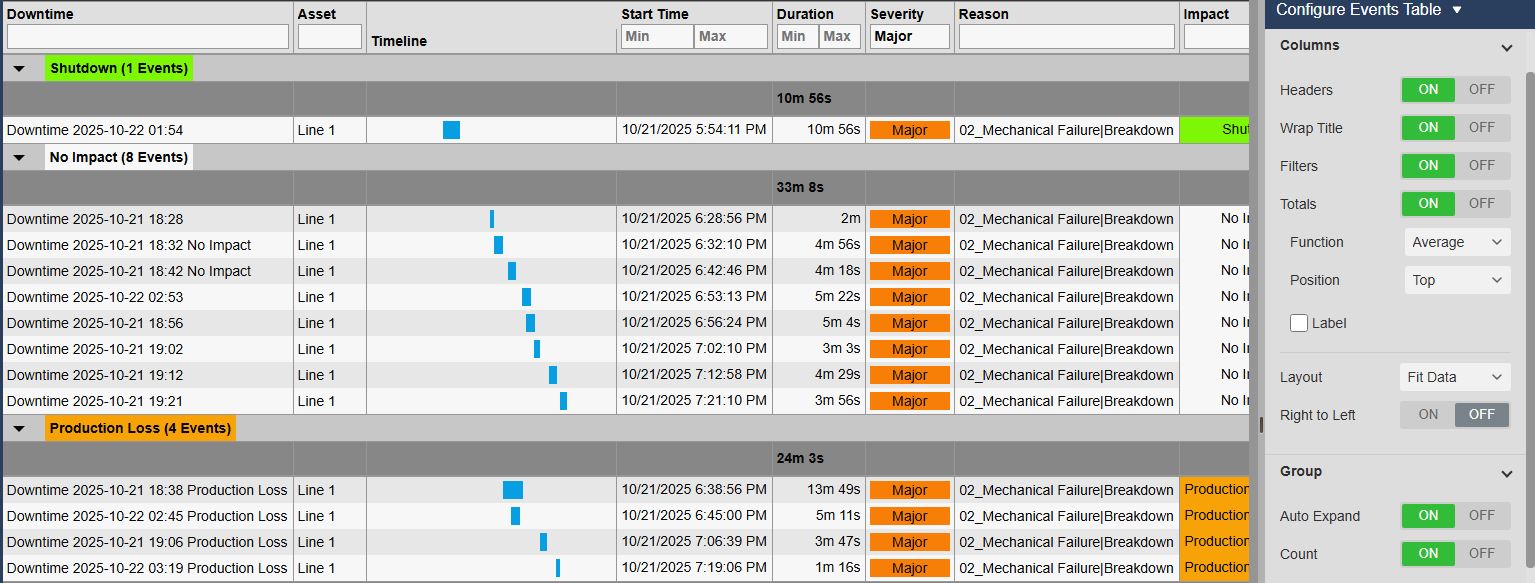
  • Filters below the column headers: text, a list for severity and Min/Max ranges for times and durations.
  • Group by a column, with the number of events in each group header.
  • Column totals with Sum, Average, Min, Max or Count, at the top or the bottom.
  • Export the events to CSV, JSON, XLSX or PDF.
Events Table+ filtered to severity Major and grouped by impact, with event counts and duration totals per group, next to the Table settings with Headers, Wrap Title, Filters, Totals, Function, Position, Layout and the Group options Auto Expand and Count
Severity filter, groups with event counts and totals, and the Table settings. Demo data. Select the image to enlarge.

Edit, create and split Event Frames in PI Vision

In Edit mode, authorised users correct and complete Event Frames in the table. Changes go to the PI System through PI Web API with each user’s own permissions.

Edit events and their attributes

Let operators complete downtime reasons and event attributes where they already look at the events.

  • In Edit mode, choose per column which cells can be edited, and highlight all or only empty input cells.
  • Enumeration sets as a dropdown or a dialog, sorted by name or value.
  • Changes wait for Save; Auto Save writes each change immediately instead.
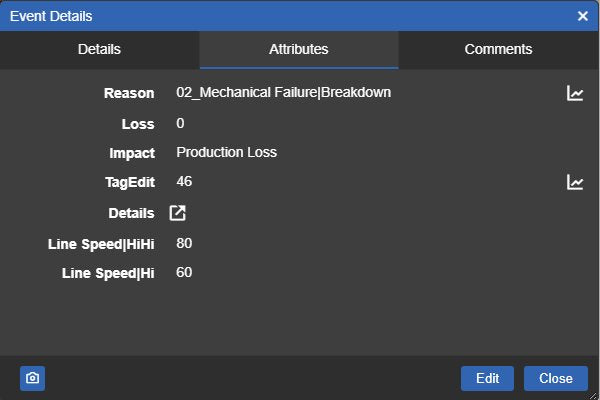
  • The Event Details window lists the event’s attributes and opens them for editing.
The Attributes tab of the Events Table+ Event Details window with the reason, loss, impact and limit attributes of one downtime event, a trend icon beside two attributes and the Edit and Close buttons
Attributes of one event in the Event Details window. Demo data. Select the image to enlarge.

Create, split and copy events

Record events the PI System did not detect, and fix events that cover more than one cause.

  • Creation buttons in the table toolbar, each with its own title, colour, icon and Event Frame template.
  • Each button opens a form with the properties and attributes you choose, or creates the event directly.
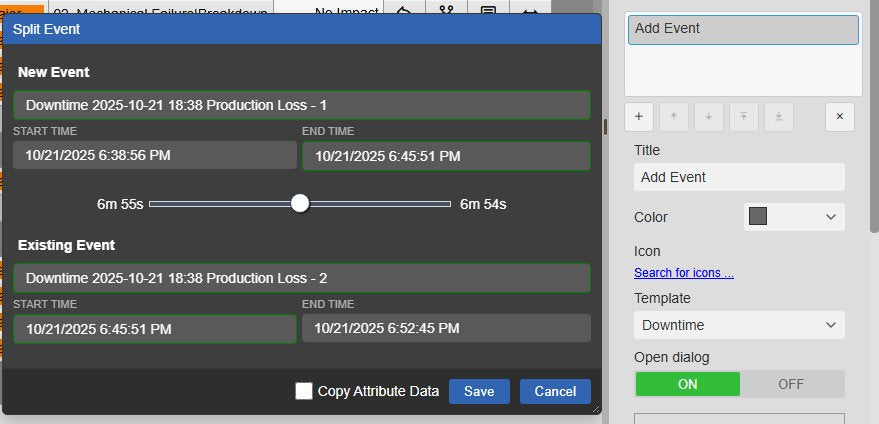
  • Split an event at a point chosen with a slider, optionally copying its attribute data to the new event.
  • Copy an event and adjust its name, times, severity and description.
The Events Table+ Split Event dialog with the new and the existing event, their start and end times and the split slider at the middle of a 13-minute downtime, Copy Attribute Data, Save and Cancel, next to the Creation settings with an Add Event button, its title, colour, icon, Downtime template and Open dialog
Split Event dialog and the Creation settings for an Add Event button. Demo data. Select the image to enlarge.

Event details, quick actions and linked event selection

Go from a row in the table to the event’s details, its time range and the rest of the display.

Event Details window and quick actions

Open everything about one event with a click, and act on it from the row.

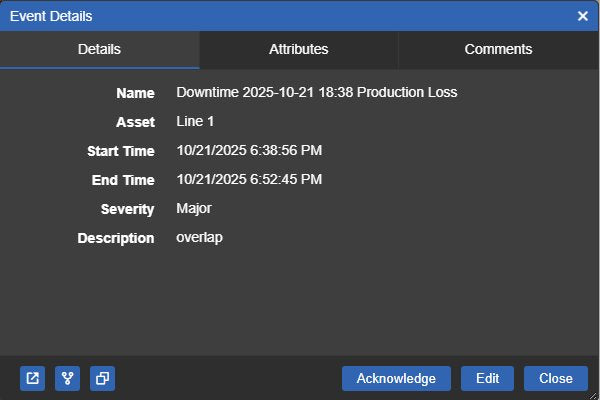
  • The Event Details window shows the event, its attributes with a trend icon, and its comments.
  • Acknowledge or edit the event from the same window.
  • Quick action buttons in each row: open the details, split or copy the event, apply its time range or set the asset context.
  • Or open PI Vision’s own event details page, or trend the row from the context menu.
The Events Table+ Event Details window with the Details, Attributes and Comments tabs, showing the name, asset, start time, end time, severity and description of one downtime event, with Acknowledge, Edit and Close buttons
Event Details window opened from the Details quick action. Demo data. Select the image to enlarge.

Linked event selection, time bar and export

Make the table the place where users pick events for the rest of the dashboard.

  • Choose what a row click does: open the details, apply the time range, set the asset context, filter other symbols or nothing.
  • Filtering outputs publish the selection to other symbols; inputs receive Master and Linked filters, for example from Event Filter+.
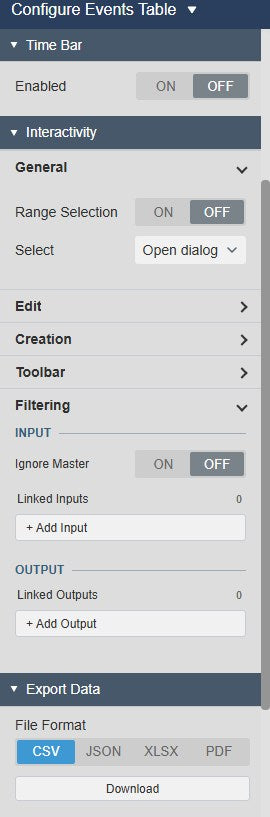
  • A Time Bar gives the table its own event search range.
  • Export the table, or add a Download button to its toolbar.
Events Table+ settings with the Time Bar switch, the Interactivity General options Range Selection and Select, the Filtering inputs and outputs, and the Export Data file formats CSV, JSON, XLSX and PDF
Time Bar, Interactivity, Filtering and Export Data settings. Select the image to enlarge.

PI Vision event frame table examples

Four ways teams can set up Events Table+. Templates and attribute names are examples.

Downtime log

Data
Downtime Event Frames with a reason code and a comment attribute
Settings
Edit mode, Allow Edit on Reason and Comment, Highlight Input Cells Empty, Auto Save Off
Shows
Operators complete reason and comment for each stop and save them together

Downtime review

Data
Downtime Event Frames for one line
Settings
Read Only, grouped by impact, duration totals, Severity filter
Shows
Stops per impact with their total duration, filtered to the severe ones

Shift handover

Data
Event Frames of one area with child events
Settings
Grouped by asset, header filters, child events as a tree, a comments column
Shows
Open events per asset with their notes for the next shift

Event drill-down

Data
Event Frames for several assets
Settings
Row click set to Filter, a Filtering output on the asset
Shows
Selecting a row filters the event charts on the same display

Events Table+ FAQ

Questions we are asked most often. Read the Events Table+ documentation or ask a technical question.

When should we use Events Table+ instead of the PI Vision events table, Event Gantt Chart+ or Event Analytics Pivot+?

Use Events Table+ when users need the individual events as rows: to filter, group, total, export or edit them. It builds on the PI Vision events table and adds filtering, grouping, totals, export and Event Frame editing. Use Event Gantt Chart+ when duration, overlap and sequence on a timeline matter more than exact rows, and Event Analytics Pivot+ when you need event statistics across two dimensions rather than the events themselves. For working through events one at a time as editable cards, use Event Frame Form+.

Which actions change data in the PI System?

In Read Only mode the table only reads, except for acknowledging an event. In Edit mode, Save writes the changed cells and deleted rows, or Auto Save writes each change at once. Creating, splitting and copying events, adding comments and acknowledging an event also write to AF. Every write goes through PI Web API with the user’s own permissions, so PI Web API must allow writes and users need write access to the Event Frames. Editing attributes in the Event Details window also needs the Manual Data Entry flag on the AF attribute.

How many events can the table show?

By default up to 900 events per search, the default maximum of PI Web API. Your PI administrator can raise the limit to as many as 10,000 events, as described in the Vision Library+ Administration and Installation Guide.

Can selecting events filter other symbols?

Yes. Set the row click to Filter and add a Filtering output, and other Vision Library+ symbols map that output to one of their own properties. Events Table+ also receives Master and Linked filters, for example from Event Filter+, and applies them to the events it has already loaded.

What do we need to run it?

PI Vision 2021 or later with PI Web API, and PI AF Server 2018 SP2 or later with Event Frames that the PI Vision event search finds. Read Only tables need no write access. For editing, creating, splitting or commenting, PI Web API must allow writes and users need write permission on the Event Frames; administrators can also restrict the configuration pane to PI Vision administrators.

How do we get Events Table+?

Events Table+ is part of Vision Library+, together with the other Vision Library+ symbols. Request a trial to test it in your own PI Vision environment.

Try Events Table+ in your PI Vision

Events Table+ is included in Vision Library+, the PI Vision custom symbol library from Software Athlete. Test it on your own displays and data.