Duval Triangle+ for AVEVA PI Vision

PI Vision Duval Triangle for transformer DGA

See where the dissolved-gas results of a transformer or tap changer fall on the Duval Triangle, right in your PI Vision display. Duval Triangle+ turns three gas values from PI tags or AF attributes into relative percentages, plots them on Triangle 1, 2, 4 or 5 and shows the zone the point falls in.

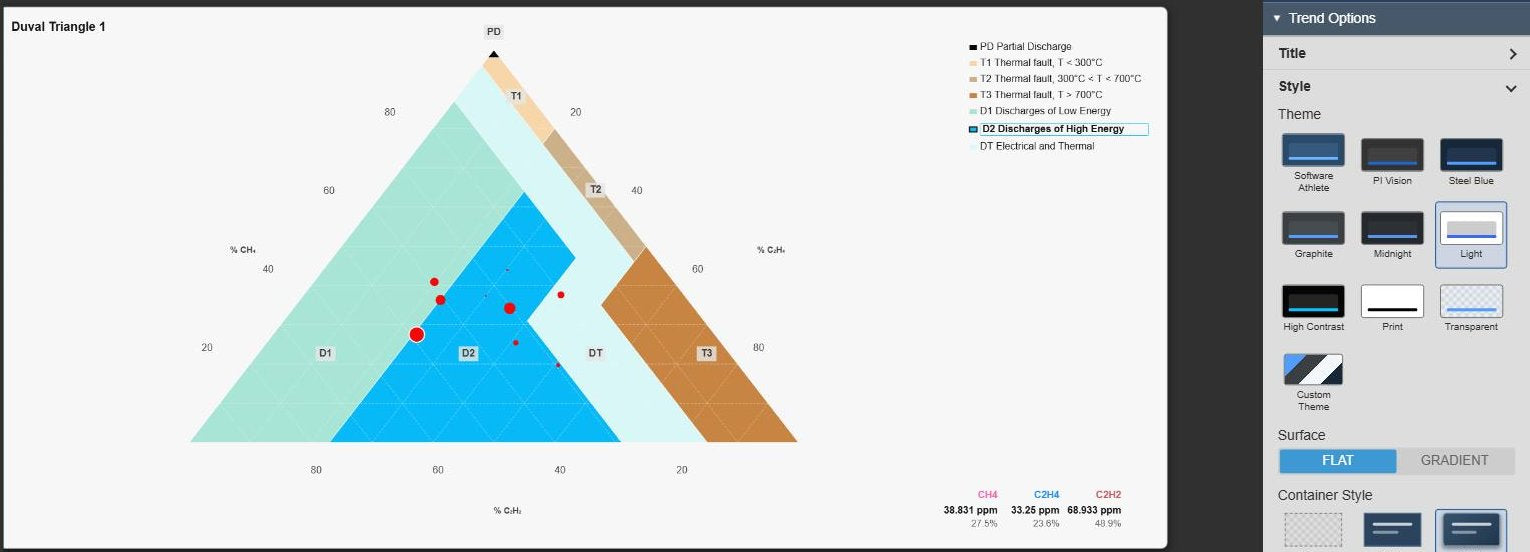
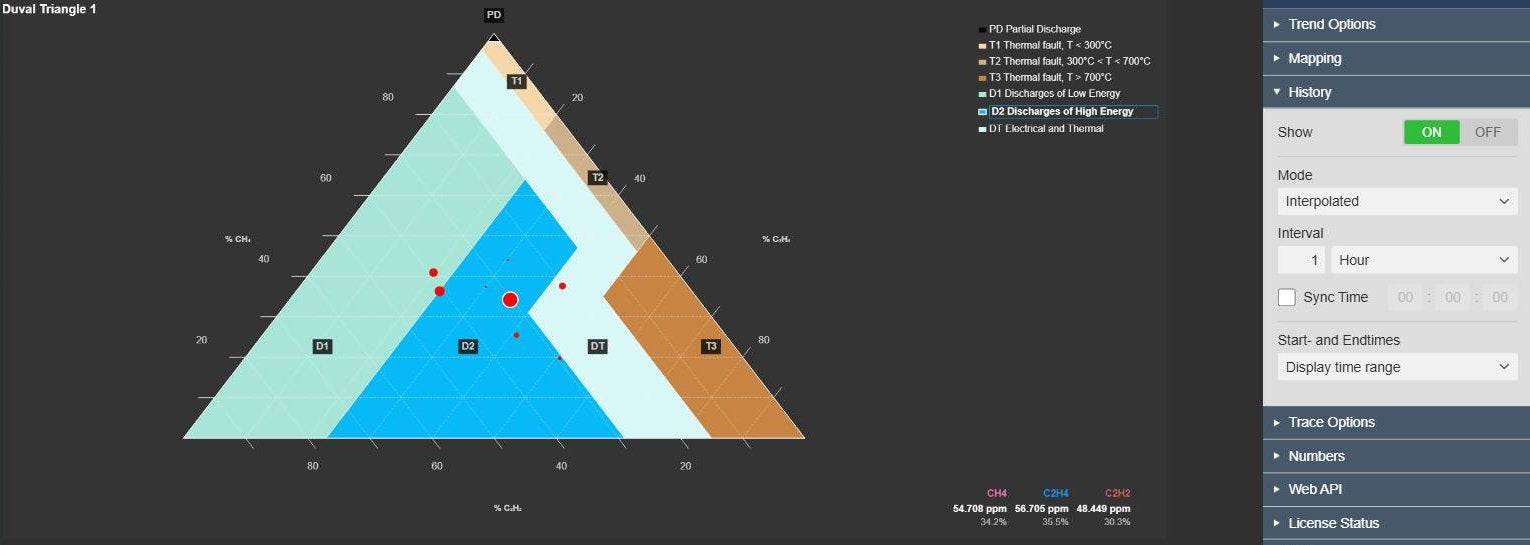
Duval Triangle+ in PI Vision showing Duval Triangle 1 with zone labels, the current result as a large red point in zone D2, a trail of smaller earlier results, the zone legend with D2 Discharges of High Energy highlighted and the gas panel with methane, ethylene and acetylene in ppm and per cent, next to the History settings with Show on, mode Interpolated, interval 1 hour and the display time range
Duval Triangle+ v2.0 in PI Vision: Triangle 1 with the history trail, the zone legend and the gas panel, next to the History settings. Demo data (simulated gas values). Select the image to enlarge.

Duval Triangles 1, 2, 4 and 5 in PI Vision

Pick the triangle that fits the equipment and the question. Gases, zones and legend change with it.

Triangle 1 for transformers in mineral oil

The classic Duval Triangle plots methane, ethylene and acetylene as relative percentages and shows which zone the result falls in. Choose the triangle and the data source of each gas in the Mapping settings.

  • Methane (CH₄), ethylene (C₂H₄) and acetylene (C₂H₂), one PI tag or AF attribute each.
  • Zones PD, T1, T2, T3, D1, D2 and DT, with their names in the legend.
  • The zone of the current result highlighted in the legend.
  • No point is drawn while a value is missing or not numeric.
Duval Triangle 1 in PI Vision with zone labels, a trail of earlier results and the current result on the boundary between zones D1 and D2, with D2 highlighted in the legend, next to the Mapping settings with Duval Type Triangle 1 (Classic) and the data sources Duval|CH4, Duval|C2H4 and Duval|C2H2 mapped to CH4 (Methane) [Axis A], C2H4 (Ethylene) [Axis B] and C2H2 (Acetylene) [Axis C]
Triangle 1 next to the Mapping settings: the Duval Type and one data source per gas. Demo data (simulated gas values). Select the image to enlarge.

Triangle 2 for load tap changers

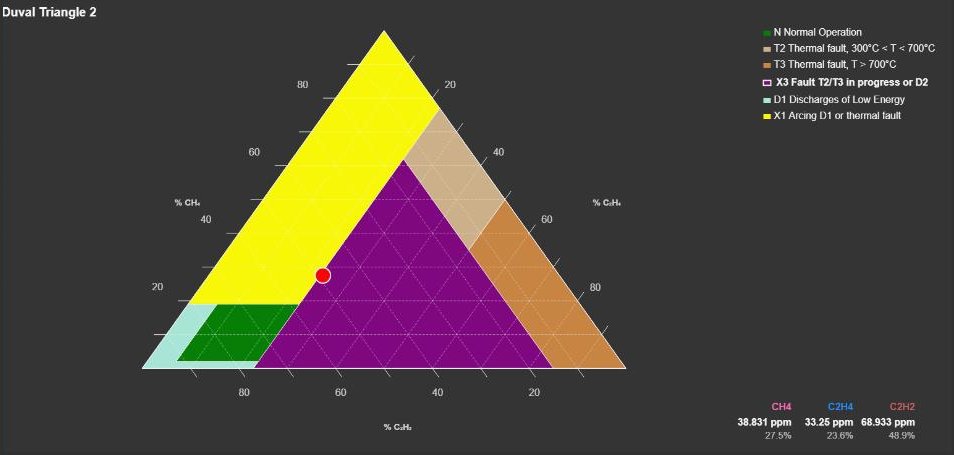
Load tap changers produce gases during normal switching. Triangle 2 uses the same three gases with its own zones, including one for normal operation.

  • For load tap changers that operate in oil.
  • Methane, ethylene and acetylene, as in Triangle 1.
  • Zone N for normal operation, and zones D1, X1, T2, T3 and X3 for abnormal arcing and thermal faults.
  • Full zone names in the legend, such as “X3 Fault T2/T3 in progress or D2”.
Duval Triangle 2 for load tap changers in PI Vision with the zones N, T2, T3, X3, D1 and X1, the legend with their full names and X3 highlighted for the current result on the X1/X3 boundary, and the gas panel with methane, ethylene and acetylene in ppm and per cent
Triangle 2 for load tap changers, with the zone legend and the gas panel. Demo data (simulated gas values). Select the image to enlarge.

Triangles 4 and 5 for low-temperature and thermal faults

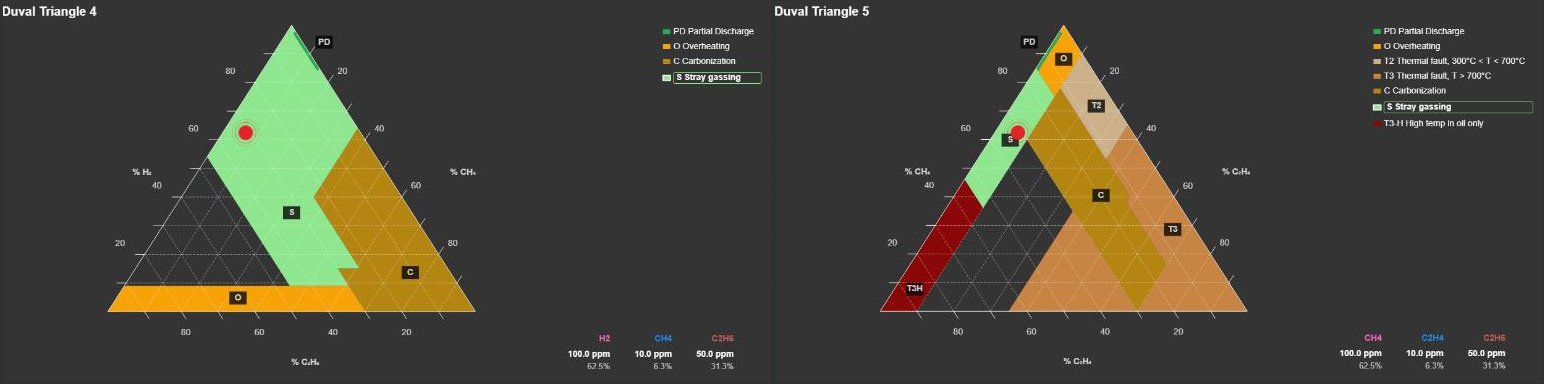
Triangles 4 and 5 use other gas combinations to separate stray gassing, overheating and carbonization of paper. Use them alongside Triangle 1 for a closer look at its result.

  • Triangle 4: hydrogen, methane and ethane, with zones PD, S, C and O.
  • Triangle 5: methane, ethylene and ethane, with zones PD, S, O, C, T2, T3 and T3-H.
  • Triangle 4 when low-energy faults, local overheating or stray gassing are suspected.
  • Triangle 5 alongside Triangle 1 for thermal faults.
Duval Triangle 4 with the zones PD, O, C and S and its gas panel with hydrogen, methane and ethane, next to Duval Triangle 5 with the zones PD, O, T2, T3, C, S and T3-H and its gas panel with methane, ethylene and ethane; on both the current result lies in zone S, highlighted as Stray gassing in the legend
Triangle 4 (left) and Triangle 5 (right), both with the result in zone S. Demo data (simulated gas values). Select the image to enlarge.

DGA history and gas composition in PI Vision

Use the gas values you already store in PI, from an online DGA monitor or from laboratory results, and see where they lie now and where they came from.

History trail, gas panel and themes

Switch on History to see how the gas ratios moved over the time range, not only where they are now. Keep the gas values beside the triangle and match the symbol to your display.

  • Earlier results as smaller points behind the current one, from the display time range, a custom range or a duration and offset.
  • Interpolated values or summaries at an interval you set.
  • Gas composition panel with each gas in ppm and per cent.
  • Built-in themes such as Light, Print or High Contrast, or a custom theme, with surface and container styles.
Duval Triangle+ in the Light theme with a card container, showing Triangle 1 with zone labels, a trail of earlier results, D2 highlighted in the legend and the gas panel with methane, ethylene and acetylene in ppm and per cent, next to the Style settings with the theme grid with Light selected, the surface Flat or Gradient and the container styles
The history trail and the gas panel in the Light theme with a card container, next to the Style settings. Demo data (simulated gas values). Select the image to enlarge.

Duval Triangle zones, axes and the current point

Match the triangle to your colour standards and make the current result easy to find on a busy display.

Zone colours and labels, axes and point style

Set how the zones and axes are drawn and how the current result stands out. The legend sits left or right of the triangle, with its own alignment and size.

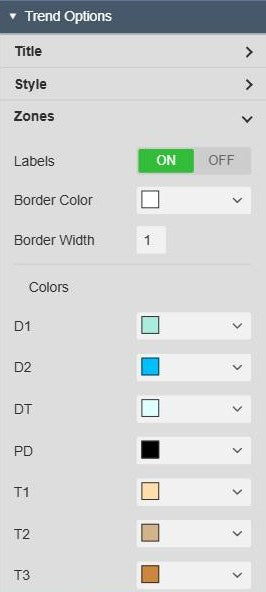
  • Zone labels on or off, with zone border colour and width.
  • Your own fill colours for the Triangle 1 zones, and for O, C and T3-H on Triangles 4 and 5.
  • Axes with grid lines, ticks inside or outside, and tick labels.
  • The current point with its own colour, border and size, and an optional pulse.
Duval Triangle+ Zones settings under Trend Options with zone labels on, the border colour, border width 1 and the fill colours of zones D1, D2, DT, PD, T1, T2 and T3
Zones settings for Triangle 1: labels, borders and one colour per zone. Select the image to enlarge.

PI Vision Duval Triangle examples

Four common ways teams use Duval Triangle+ on their displays.

Power transformer with an online DGA monitor

Data
Methane, ethylene and acetylene from the monitor’s PI tags
Settings
Triangle 1, history over the last 30 days
Shows
Which zone the latest result falls in and how the gas ratios moved

On-load tap changer

Data
Methane, ethylene and acetylene of the tap changer oil
Settings
Triangle 2 (LTC), zone legend on
Shows
Whether the result stays in the zone for normal operation

Closer look at a thermal result

Data
Hydrogen, methane, ethylene and ethane of the same transformer
Settings
Triangle 4 and Triangle 5 side by side
Shows
Whether the gases point to stray gassing, overheating or carbonization of paper

Transformer overview display

Data
The gas attributes of one AF transformer element, beside load and temperatures
Settings
Triangle 1 with the gas composition panel
Shows
The latest gas percentages and zone next to the operating data

Duval Triangle+ FAQ

Questions we are asked most often. Read the Duval Triangle+ documentation or ask a technical question.

Does Duval Triangle+ diagnose transformer faults?

No. It plots the gas results on the selected Duval Triangle and shows the zone the point falls in. A ratio method is only meaningful when the gas levels are high enough, and the result has to be read together with the gas concentrations, their rate of increase and the history of the equipment. That assessment stays with qualified engineers and your organisation’s DGA procedure, for example one based on IEC 60599 or IEEE C57.104.

Which Duval Triangle should we use?

Triangle 1 for transformers filled with mineral oil, and Triangle 2 for load tap changers that operate in oil. Triangles 4 and 5 complement Triangle 1: Triangle 4 (hydrogen, methane, ethane) when low-energy faults, local overheating or stray gassing are suspected, and Triangle 5 (methane, ethylene, ethane) for thermal faults.

Which gas values does it need, and in which unit?

Three numeric values for the selected triangle, one PI tag or AF attribute per gas, for example from an online DGA monitor or laboratory results stored in PI. The symbol uses their relative percentages, so all three must use the same unit; the gas panel labels the values ppm. While a value is missing or not numeric, no point is drawn.

Can we see how the gas ratios develop over time?

Yes. Switch on History and the symbol plots earlier results from the display time range, a custom range or a duration and offset as smaller points behind the current one. The values are retrieved as interpolated values or summaries at an interval you set, so choose an interval that fits how often the gases are measured.

What do we need to run it?

PI Vision 2021 or later with PI Web API, and PI AF Server 2018 SP2 or later. Duval Triangle+ runs in PI Vision and uses each user’s existing PI permissions.

How do we get Duval Triangle+?

Duval Triangle+ is part of Vision Library+, together with the other Vision Library+ symbols. Request a trial to test it in your own PI Vision environment.

Try Duval Triangle+ in your PI Vision

Duval Triangle+ is included in Vision Library+, the PI Vision custom symbol library from Software Athlete. Test it on your own displays and data.