Event Analytics KPI+ for AVEVA PI Vision

PI Vision event frame KPIs as dashboard cards

Count your downtime events, total their duration or lost production, or take the median of an event attribute, as KPI cards at the top of a PI Vision display. Event Analytics KPI+ calculates every card from the Event Frames returned by its event search.

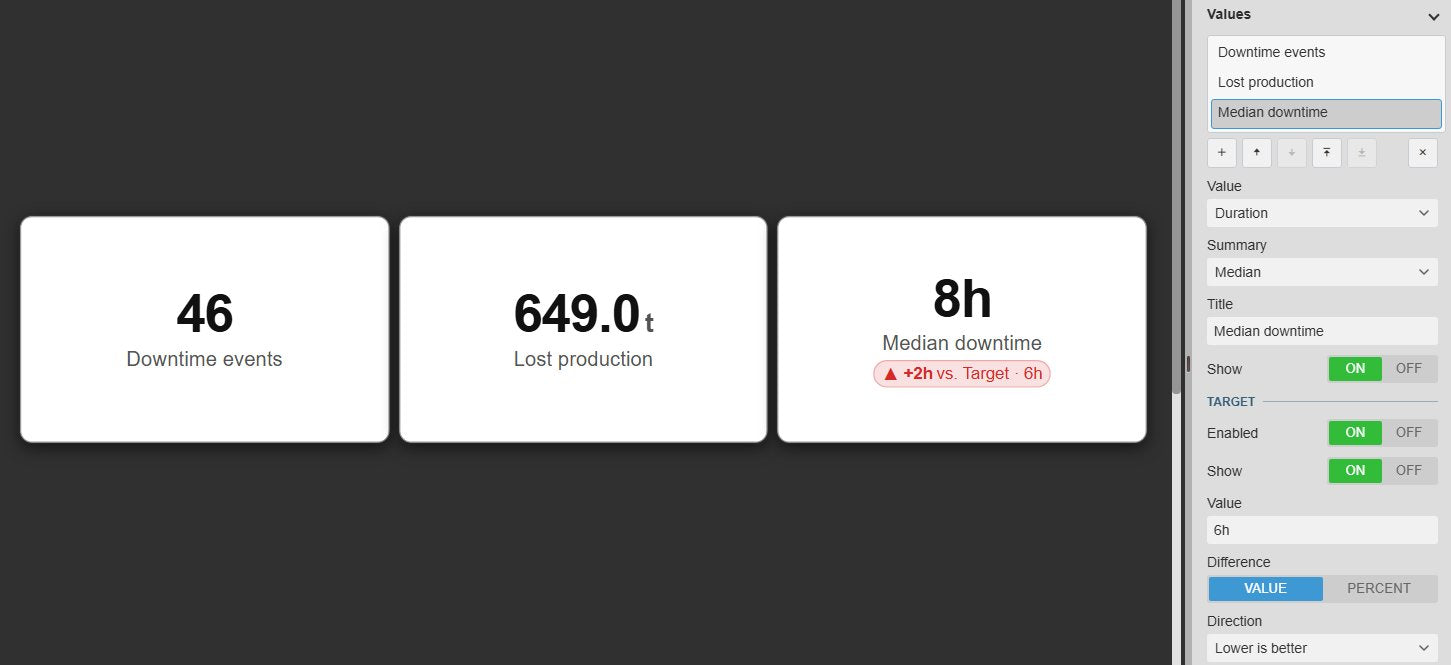
Event Analytics KPI+ in PI Vision with three white KPI cards for downtime Event Frames: 46 downtime events, 649.0 t lost production and a median downtime of 8h with the red target badge +2h vs. Target 6h, next to the Values settings with the value Duration, the summary Median, the title Median downtime and the target settings Enabled, Show, Value 6h, Difference Value and Direction Lower is better
Event Analytics KPI+ v2.0 in PI Vision: downtime KPIs from Event Frames with a duration target. Demo data. Select the image to enlarge.

PI Vision KPI cards from Event Frames

Choose the events once, decide what to calculate, and get one card per KPI instead of a list of event rows.

Count events, total their duration or summarise an attribute

Each card summarises every event the search returns, so one symbol answers how many, how long and how much.

  • Events from the PI Vision event search criteria, such as one event frame template, opened from the right-click menu.
  • Count, Count Distinct, Sum, Minimum, Maximum, Average, Median and Standard Deviation.
  • Event properties such as Duration, shown as readable timespans, and event frame attributes such as lost production, with their units.
  • Several values in one symbol, each with its own card title.
Event Analytics KPI+ cards for 46 downtime events, 649.0 t lost production and a median downtime of 8h, next to the PI Vision Search Criteria pane with the database Production, the time range, the event type Downtime, the asset name and the search mode Events Active in Time Range
The event search on the Downtime template decides which Event Frames the cards summarise. Demo data. Select the image to enlarge.

KPI cards that fit the dashboard

Arrange the cards as the top row of a dashboard or as a grid beside a chart, and match them to the display.

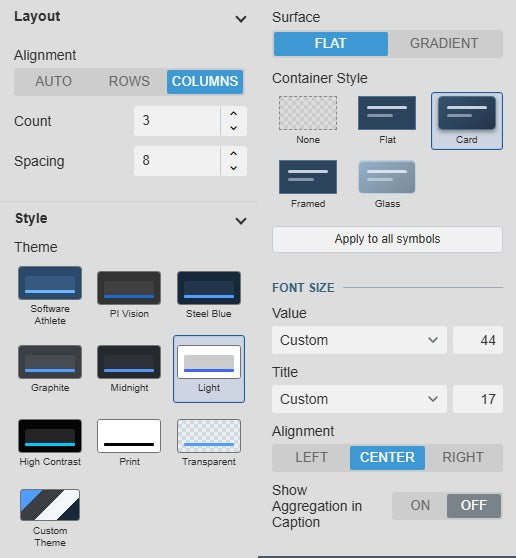
  • Automatic layout, or a fixed number of rows or columns, with adjustable spacing.
  • Themes such as PI Vision, Light, High Contrast or Print, or a custom theme with your own colours and font.
  • Flat or gradient surfaces and container styles such as Card, Framed or Glass.
  • Separate font sizes for the value and the title, and left, centred or right text.
Event Analytics KPI+ Card Options settings: Layout with Auto, Rows and Columns, Count and Spacing, the theme grid with Light selected, Surface Flat or Gradient, the container styles None, Flat, Card, Framed and Glass, the font sizes for value and title, the text alignment and Show Aggregation in Caption
Card layout and style settings. Demo data. Select the image to enlarge.

Group event KPIs by reason, asset or event property

Split a KPI into one card per group, then keep the groups that matter most.

One card per reason, asset or other event property

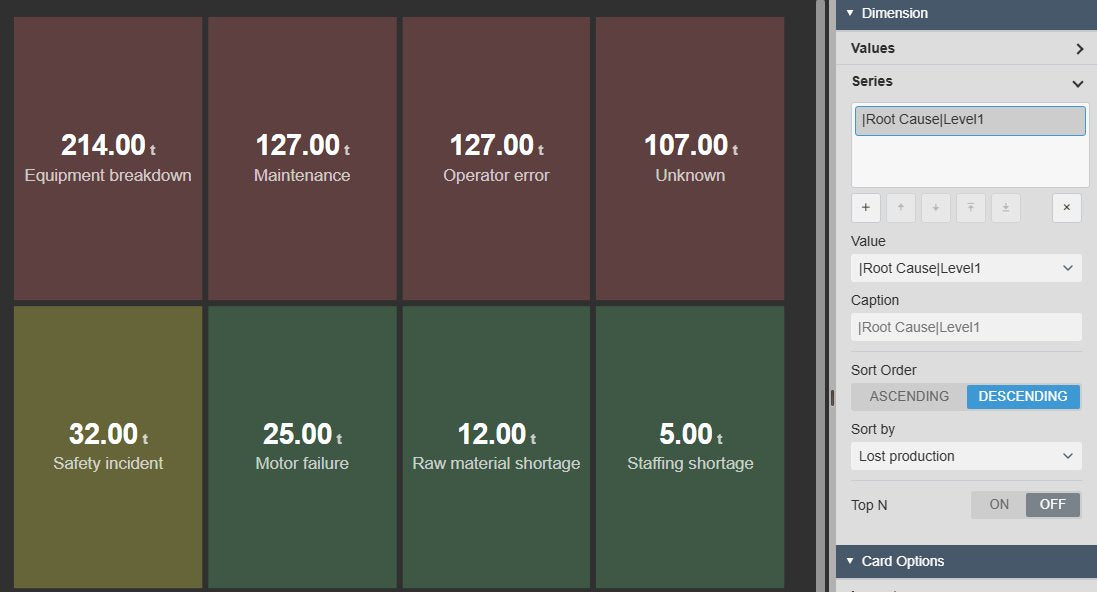
Add a series and the symbol creates a card for every category, so reasons, assets or event types sit side by side.

  • Group by the event asset or by any event property or attribute, such as a downtime reason.
  • Hierarchical attributes can be grouped by level, such as the first level of a root cause.
  • Two series give one card per combination, such as each root cause and sub-cause.
  • Cards sorted ascending or descending by any of the values.
Event Analytics KPI+ with one card per root cause showing the lost production of each cause, from 214.00 t for equipment breakdown down to 5.00 t for staffing shortage, coloured by multi-state limits, next to the Series settings with the value Root Cause Level1, sort order Descending, Sort by Lost production and Top N Off
Lost production for each root cause, sorted descending. Demo data. Select the image to enlarge.

Top or bottom N with an Others card

Show only the worst actors and still keep the grand total in view.

  • Top or bottom N categories, ranked by any of the values.
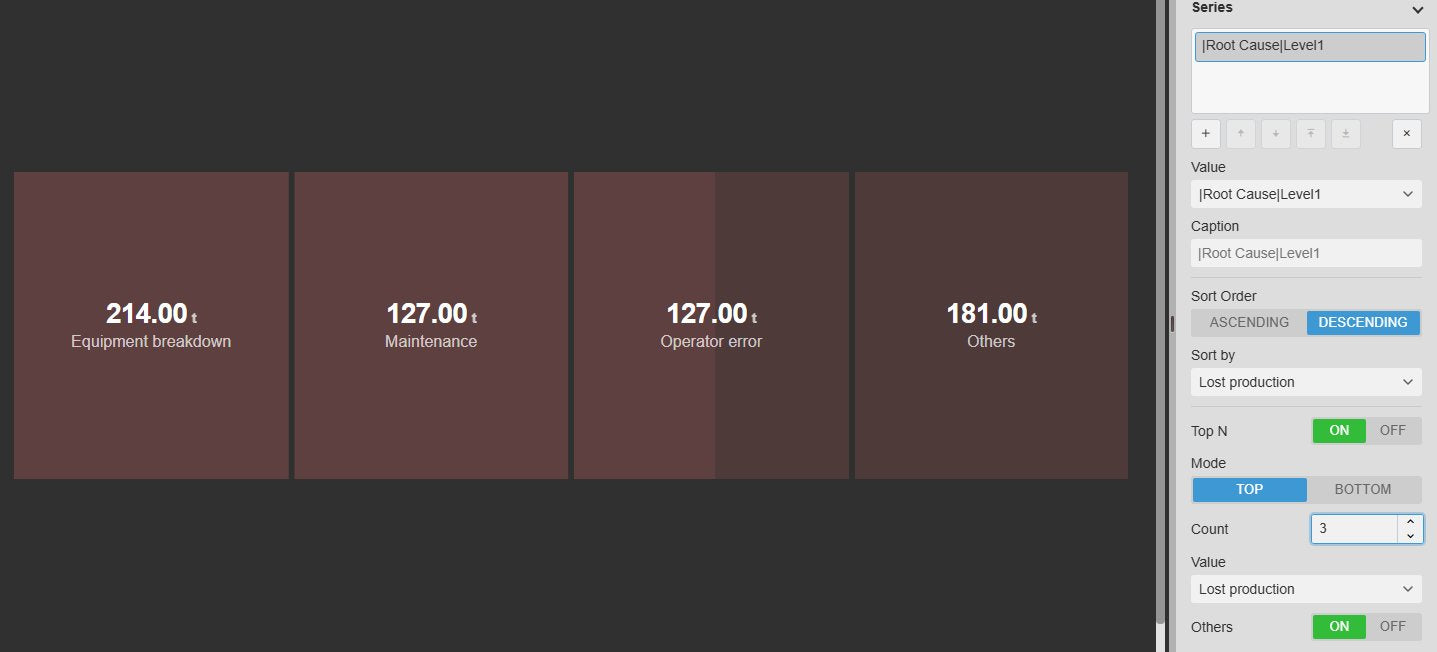
  • An Others card applies the same summary to the remaining categories, so with Sum the total stays visible.
  • Rank reasons by lost production or assets by event count.
Event Analytics KPI+ with cards for the three root causes with the most lost production, equipment breakdown, maintenance and operator error, and an Others card with 181.00 t for all other causes, next to the Top N settings with mode Top, count 3, the value Lost production and Others On
The three root causes with the most lost production and an Others card for the rest. Demo data. Select the image to enlarge.

Event KPI targets, status colours and drilldown

Show whether each card is on target, colour the ones that need attention, and let a click lead to the detail.

Targets and multi-state colours on every card

Read at a glance how far each card is from its benchmark and which groups are outside their limits.

  • A fixed target per value, applied to every card of that value, with the difference as a value or a percentage.
  • Higher is better or lower is better sets the badge colour; the arrow shows above or below target.
  • Duration targets are typed as timespans, such as 6h.
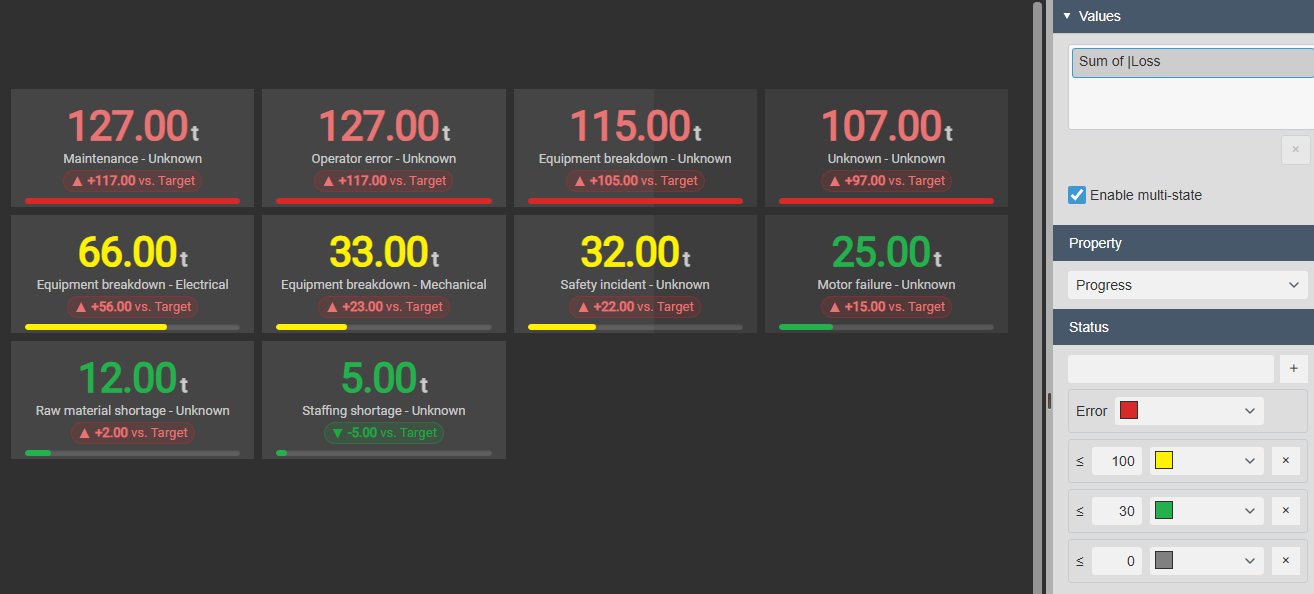
  • Multi-state limits per value with eleven styles, such as text colour, soft fill or a progress bar, plus an error colour.
Event Analytics KPI+ with one card per root cause and sub-cause, each with lost production, a target badge such as +117.00 vs. Target and a progress bar coloured red, yellow or green by multi-state limits, next to the Configure Multi-State pane with Enable multi-state, the property Progress, the limits 100, 30 and 0 and the Error colour
Lost production per root cause and sub-cause with target badges and multi-state progress bars. Demo data. Select the image to enlarge.

Drill down to the next level, or filter the display

Use the cards as the entry point of an event dashboard: a click opens the next level or narrows the other event symbols.

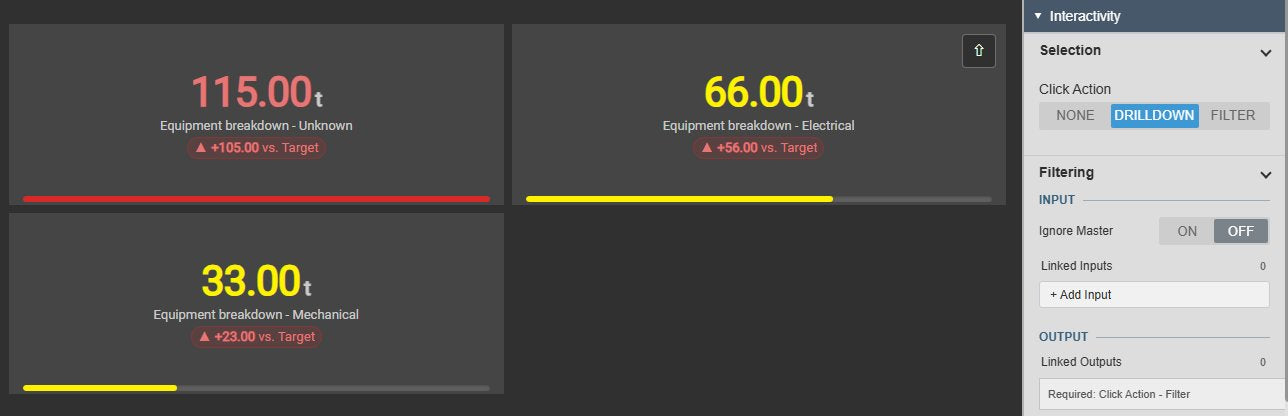
  • Drilldown: the first series shows first, a click on a card shows the next series for that group, and Drill Up returns.
  • Filter: with Click Action Filter, selected cards filter other event symbols through linked outputs.
  • Master and linked filters from Event Filter+ or other symbols narrow the events behind the cards.
  • Ignore Master keeps the KPIs independent of master filters while linked inputs still apply.
Event Analytics KPI+ after a drilldown click on the equipment breakdown card, with one card each for the unknown, electrical and mechanical sub-causes and the Drill Up button in the top right corner, next to the Interactivity settings with Click Action Drilldown and the filtering inputs and outputs
After a click on the equipment breakdown card: one card per sub-cause and the Drill Up button. Demo data. Select the image to enlarge.

PI Vision event frame KPI examples

Four common ways teams use Event Analytics KPI+ at the top of their event displays.

Downtime this week

Data
Downtime Event Frames over the display time range
Settings
Value Count with the title Downtime events, Value Sum of Duration with the title Total downtime
Shows
How many stops there were and how long they lasted, in two cards

Bad actor assets

Data
Downtime Event Frames on many assets
Settings
Series Asset, Top N 5 by the Sum of Duration with Others, multi-state limits
Shows
The five assets with the most downtime and the rest of the plant in one row

Downtime by reason

Data
Downtime Event Frames with a reason attribute
Settings
Series root cause, then sub-cause, Click Action Drilldown
Shows
Lost production per root cause first, the sub-causes of one cause after a click

Excursions against a limit

Data
Excursion or safety Event Frames
Settings
Value Count, a fixed target with Lower is better, Click Action Filter
Shows
The number of excursions against the target, and a filter for the other event symbols

Event Analytics KPI+ FAQ

Questions we are asked most often. Read the Event Analytics KPI+ documentation or ask a technical question.

When should we use Event Analytics KPI+ instead of KPI Card+ or Asset Analytics KPI+?

Use Event Analytics KPI+ when the KPI comes from Event Frames, such as the number of downtime events, their total duration or the sum of an event attribute, optionally one card per asset or reason. Use KPI Card+ for one PI Point or AF attribute, with its current value or a summary over time, a sparkline and a target. Use Asset Analytics KPI+ to summarise the current AF attribute values of many assets, such as the number of running pumps or their average flow.

Which events does it summarise?

Only the Event Frames returned by the symbol’s event search, which you set with Search Criteria in the right-click menu, for example the events of one event frame template. Event Filter+ and other filtering symbols can narrow that set further. If a card stays empty, check the search, the value and the time range first.

Can it total durations and event attributes?

Yes. Duration is shown as a readable timespan, for example the total or median downtime, and event frame attributes such as lost production can be summed, averaged or ranked with their units. Targets for durations are typed as timespans, such as 6h.

Does it work with Event Filter+ and the other event symbols?

Yes. Master and linked filters narrow the events behind the cards. With Click Action Filter, selected cards can filter other event symbols on the display in turn. Ignore Master keeps the KPIs independent of master filters.

What do we need to run it?

PI Vision 2021 or later with PI Web API, PI AF Server 2018 SP2 or later, and Event Frames in AF. Event Analytics KPI+ runs in PI Vision and uses each user’s existing PI permissions.

How do we get Event Analytics KPI+?

Event Analytics KPI+ is part of Vision Library+, together with the other Vision Library+ symbols. Request a trial to test it in your own PI Vision environment.

Try Event Analytics KPI+ in your PI Vision

Event Analytics KPI+ is included in Vision Library+, the PI Vision custom symbol library from Software Athlete. Test it on your own displays and data.