Period Comparison Chart+ for AVEVA PI Vision

PI Vision period comparison for shifts, days, months and years

See whether this shift, day, month or year is behaving like the ones before it. Period Comparison Chart+ lays the periods over each other on one aligned axis in your PI Vision display.

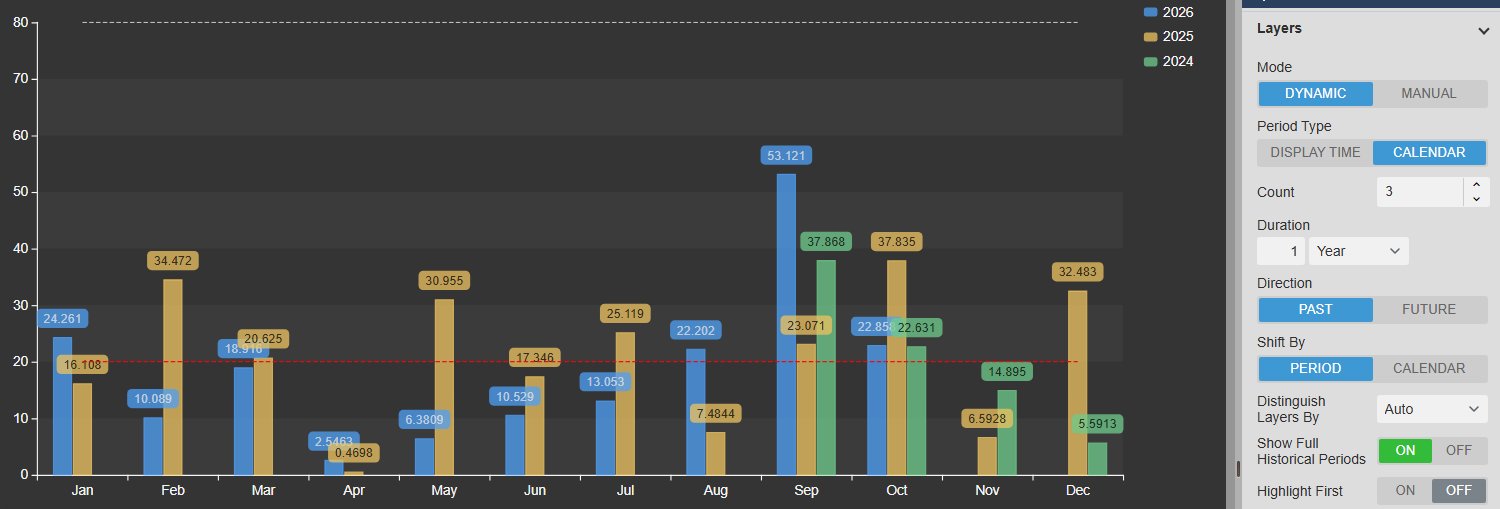
Period Comparison Chart+ in PI Vision showing monthly values for 2026, 2025 and 2024 as grouped bars from January to December, next to the Layers settings with Dynamic mode, Calendar period type, count 3 and a duration of one year
Period Comparison Chart+ v2.0 in PI Vision: this year and the two previous years as calendar layers, next to the Layers settings. Demo data. Select the image to enlarge.

Compare shifts, days, months and years in one PI Vision chart

Each layer is one period folded onto the same axis, so 10:00 today lines up with 10:00 yesterday and March this year with March last year.

Today versus yesterday, hour by hour

Generate the comparison periods from a rule, so the chart keeps comparing the right periods as the display time moves on.

  • Display Time layers repeat the selected window, such as the last 8 hours or the current shift.
  • Calendar layers snap to full days, weeks, months or years.
  • Set the number of layers, past or future, and shift by the period or a calendar unit.
  • Default, Recorded, Interpolated or Summary data, for example one value per hour.
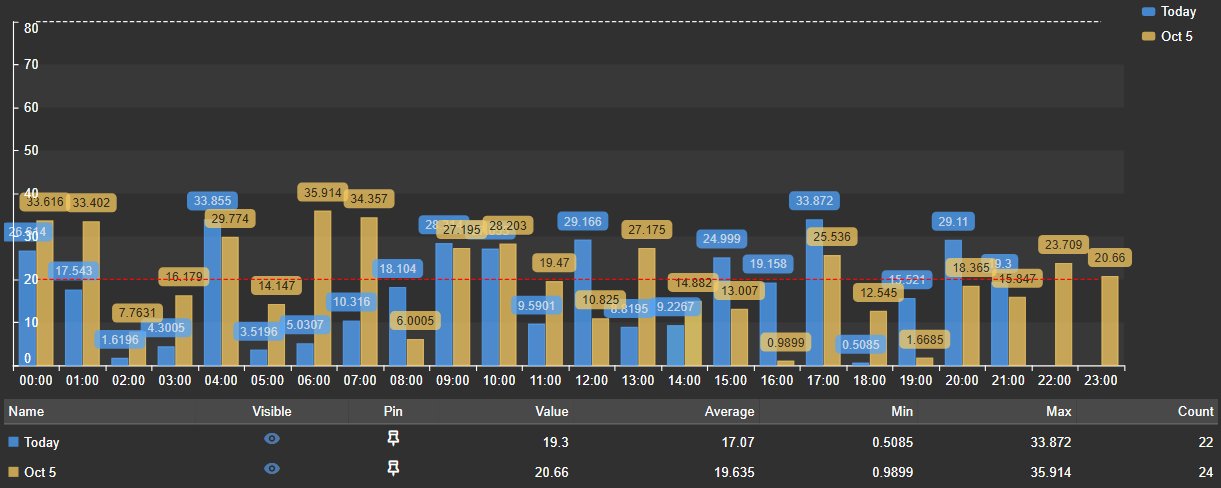
Period Comparison Chart+ with hourly bars for today and yesterday side by side from 00:00 to 23:00, value labels and a summary table with value, average, minimum, maximum and count for each layer
Calendar day layers: hourly values for today and yesterday, with the summary table. Demo data. Select the image to enlarge.

Several earlier periods at once

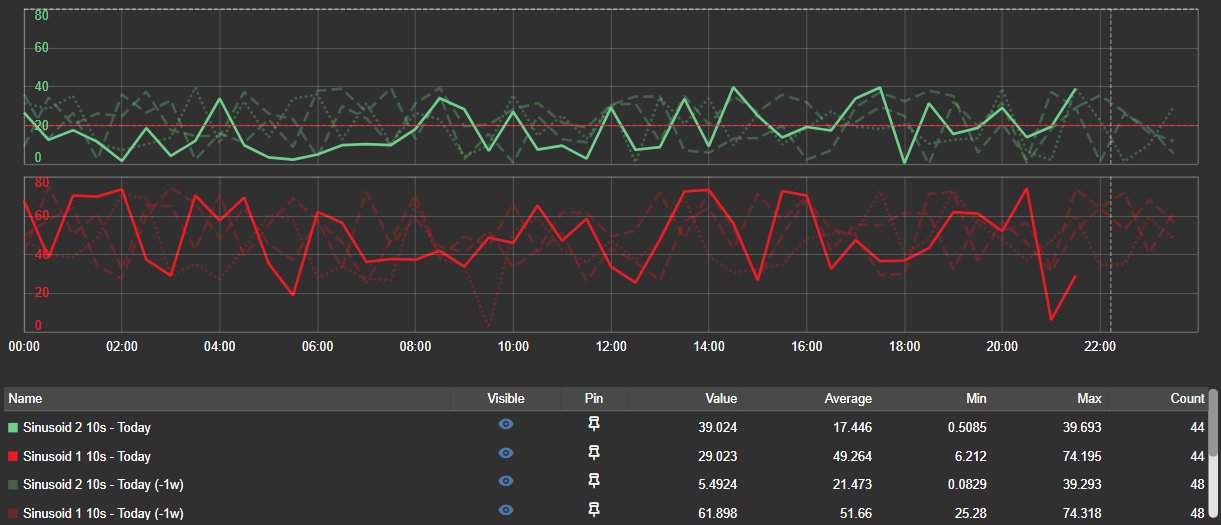
Put today next to the same day in the previous weeks and see at a glance whether it runs higher, lower or with a different shape.

  • Tell layers apart by colour, line style or opacity, or let the chart choose.
  • Earlier periods can be drawn in full while the current one is still running.
  • A current-time marker shows where now sits in the period.
  • Single, multiple, separate or custom value scales for sources with different units.
Period Comparison Chart+ with two data sources on separate scales, each showing today as a solid line and the same day one, two and three weeks earlier as dashed and dotted lines, with a dashed current-time marker and a summary table
Two data sources on separate scales: today and the same day one to three weeks earlier, with the current-time marker. Demo data. Select the image to enlarge.

Hand-picked reference periods

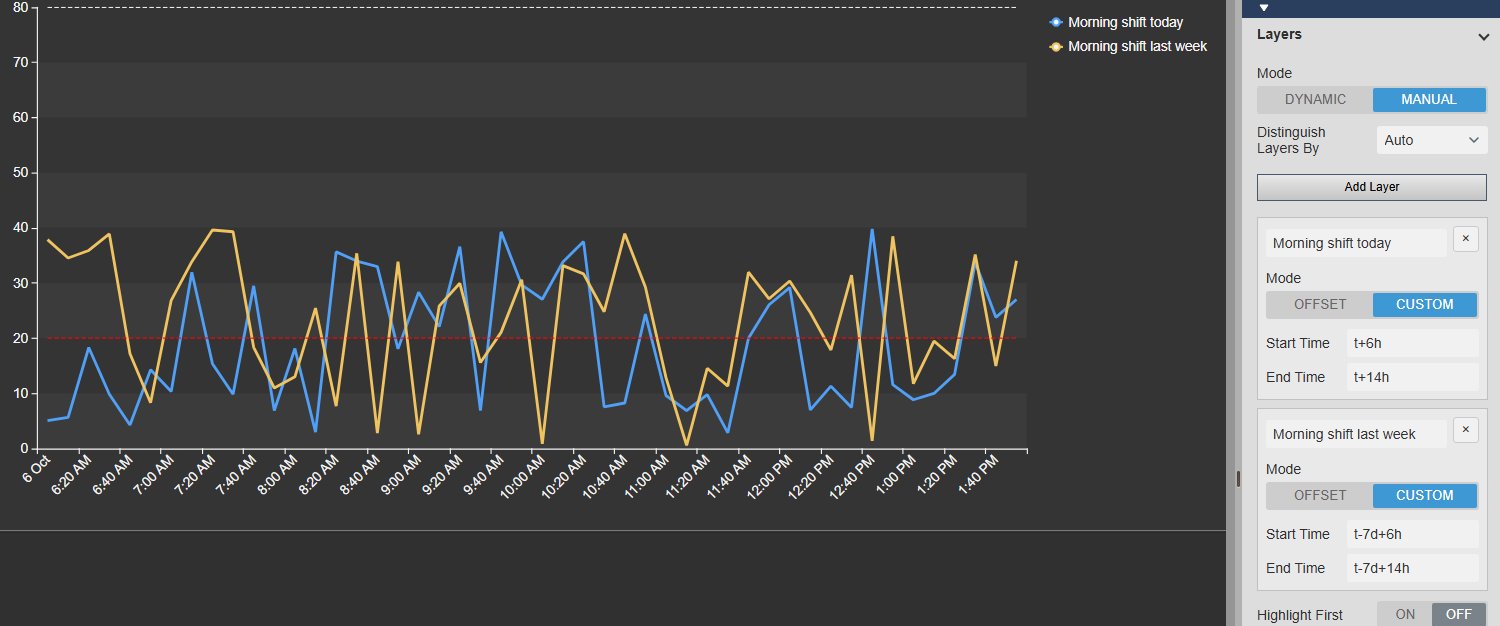
Compare against a period that no rule describes, such as a known good run, last month’s startup or the days before a process change.

  • Manual layers with their own label, as an offset or with a custom start and end time.
  • Layer labels appear in the legend and the summary table.
  • Show a data source on every layer, or on the anchor layer only, for targets and context values.
  • Highlight the first layer and fade the others into context.
Period Comparison Chart+ comparing the morning shift today with the same shift a week earlier as two lines, next to the Layers settings in Manual mode with custom start and end times for each layer
Two manual layers: the morning shift today and the same shift a week earlier, with the Layers settings. Demo data. Select the image to enlarge.

Baseline comparison with delta and percent delta

When the question is how far a period is from its reference, show the difference itself instead of asking readers to estimate it.

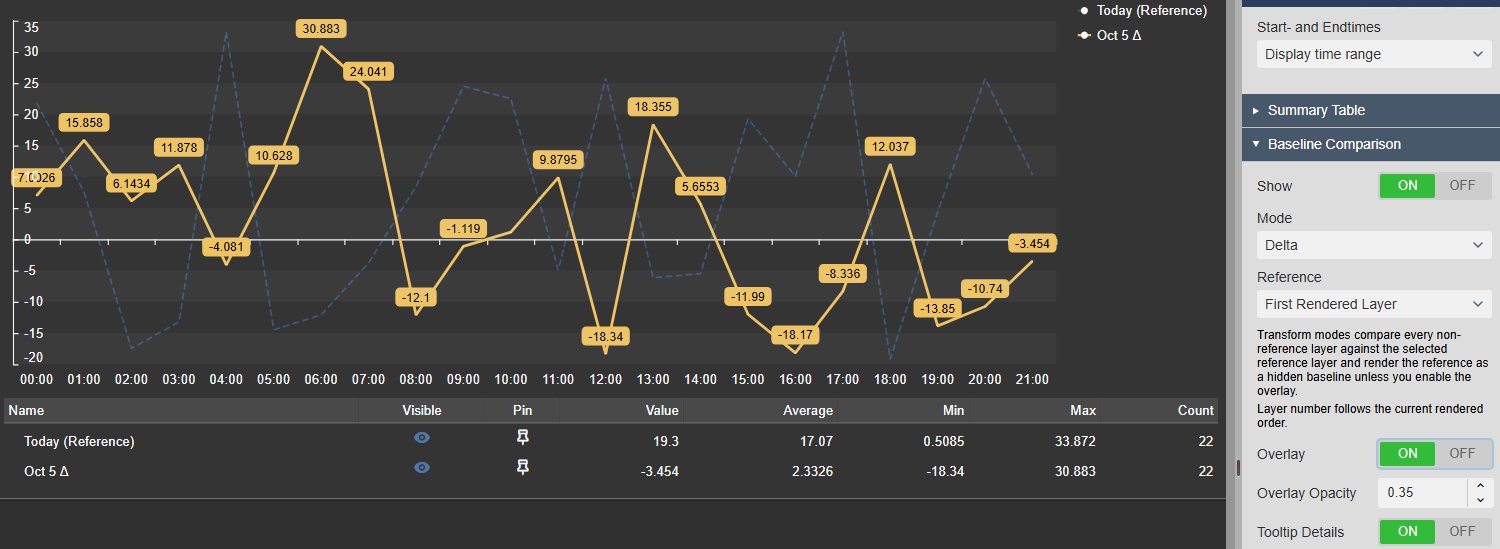
Delta and percent delta against a reference layer

Turn the comparison layers into their difference from a reference period, in engineering units or in per cent.

  • Delta for absolute differences, Percent Delta for relative change.
  • Reference: the first rendered layer, the last one or a specific layer number.
  • Overlay the reference curve with its own opacity while you read the deltas.
  • Tooltip Only keeps the chart unchanged and shows baseline, delta and percent delta on hover.
Period Comparison Chart+ in Delta mode showing the previous day as its difference from today around a zero line, with today overlaid as a faint dashed reference, next to the Baseline Comparison settings for mode, reference, overlay and tooltip details
Delta mode with the reference overlaid, next to the Baseline Comparison settings. Demo data. Select the image to enlarge.

Shade the gap between two periods

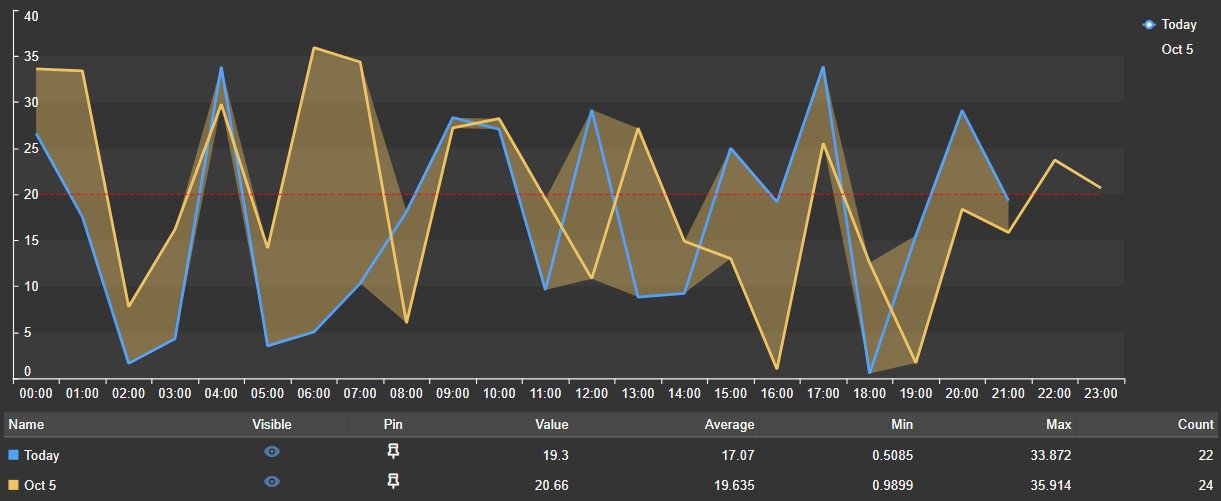
Keep both original curves and fill the area between a layer and its baseline, so larger deviations stand out.

  • Band Between Series keeps the values on the original scale.
  • Adjustable band opacity.
  • Optional tooltip details for the baseline comparison.
Period Comparison Chart+ showing today and yesterday as two lines with the area between them shaded, and a summary table below
Band Between Series: today and yesterday with the gap between them shaded. Demo data. Select the image to enlarge.

Summary table, pinned periods and export

Read exact values per layer, keep a reference period on screen and take the comparison into a report or spreadsheet.

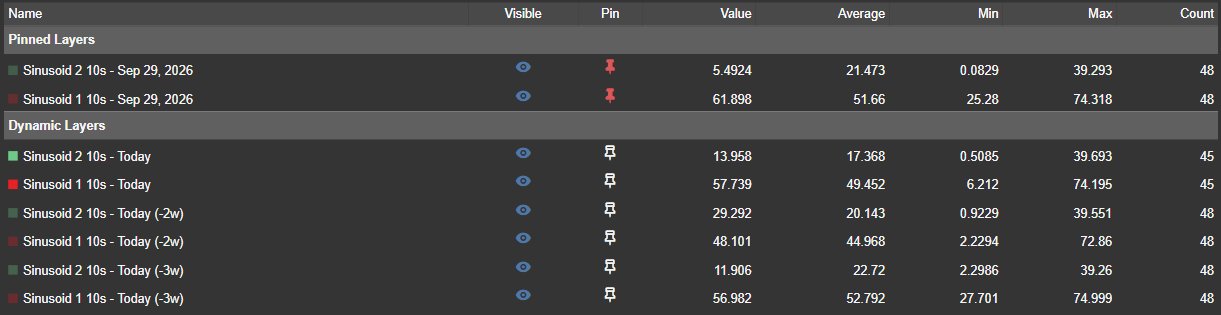
Statistics and pinned periods in the summary table

The table below the chart gives exact numbers for every layer and works as the control surface for dense comparisons.

  • Value, average, standard deviation, minimum and maximum with their times, count and sum.
  • Hide, show or isolate a layer for the current session without changing the configuration.
  • Pin a period so it stays on the chart when the display time changes.
  • Pinned periods are listed separately and never duplicated by the dynamic layers.
Period Comparison Chart+ summary table with a Pinned Layers group for September 29 above the Dynamic Layers group for today and two and three weeks earlier, with visibility and pin icons and value, average, minimum, maximum and count columns
Summary table with a pinned period above the dynamic layers. Demo data. Select the image to enlarge.

Toolbar, full screen and download

Zoom into a small difference, open the chart full screen in a review meeting, or export the aligned data.

  • Pan, box zoom, zoom in, zoom out and reset.
  • Full screen keeps legend selections and the current zoom.
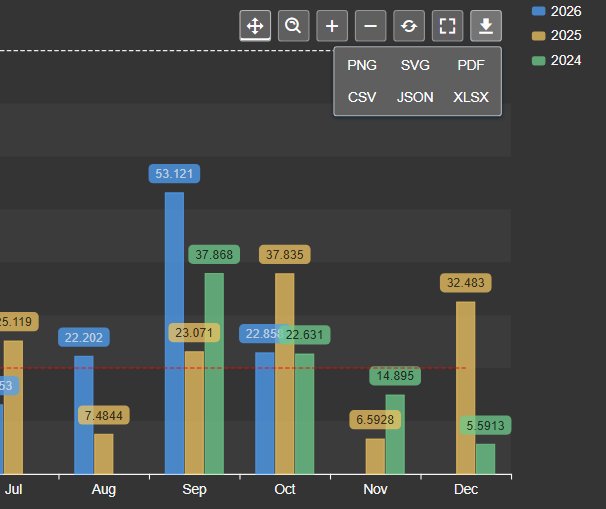
  • Download PNG, SVG or PDF, or the data as CSV, JSON or XLSX with period, aligned time and timestamp.
  • Zooming moves only the chart, never the display time.
Period Comparison Chart+ toolbar with pan, box zoom, zoom in, zoom out, reset, full screen and download buttons, and the download menu offering PNG, SVG, PDF, CSV, JSON and XLSX
Toolbar with the download menu. Demo data. Select the image to enlarge.

PI Vision period comparison examples

Four common ways teams use Period Comparison Chart+ on their displays.

Today versus yesterday

Data
A production rate or flow
Settings
Calendar layers of one day, count 2, hourly interpolated values
Shows
Whether today is ahead of or behind yesterday at the same hour

Current shift versus previous shifts

Data
A key process value
Settings
Display Time layers, count 3 or 4, shifted by the period
Shows
Drift or a slower ramp compared with the last shifts

Monthly totals year over year

Data
Energy use or throughput
Settings
Calendar layers of one year, Summary totals per month as bars
Shows
Seasonality and how this year tracks against previous years

Run against a known good period

Data
A quality or temperature value
Settings
A manual or pinned reference period, Band Between Series
Shows
Where and how far the current run deviates from the reference

Period Comparison Chart+ FAQ

Questions we are asked most often. Read the Period Comparison Chart+ documentation or ask a technical question.

How is Period Comparison Chart+ different from a PI Vision trend?

A trend shows values over clock time. Period Comparison Chart+ lays several periods over each other on one aligned axis, so equivalent positions line up, for example three hours into a shift or ten days into a month. Use a trend to see what happened, and this symbol to see how one period compares with others.

Which periods can I compare?

Dynamic layers repeat the display time window or snap to calendar days, weeks, months or years, with a count, a direction and a shift by period or calendar unit. Manual layers use an offset or a custom start and end time. You can also pin any period from the summary table.

Can I compare monthly totals or averages across years?

Yes. Use calendar layers of one year with Summary data retrieval at a one-month interval, choose a summary type such as total, average or maximum, and show the series as bars or lines.

Does zooming the chart change the display time?

No. Every period is folded onto one aligned axis, so a zoom only changes what the chart shows. The display time and the other symbols on the display stay as they are.

What do we need to run it?

PI Vision 2021 or later with PI Web API, and PI AF Server 2018 SP2 or later. Period Comparison Chart+ runs in PI Vision and uses each user’s existing PI permissions.

How do we get Period Comparison Chart+?

Period Comparison Chart+ is part of Vision Library+, together with the other Vision Library+ symbols. Request a trial to test it in your own PI Vision environment.

Try Period Comparison Chart+ in your PI Vision

Period Comparison Chart+ is included in Vision Library+, the PI Vision custom symbol library from Software Athlete. Test it on your own displays and data.