Custom Visualization+ for AVEVA PI Vision

Build your own PI Vision visualization by describing it to an AI

Describe the tank, mimic, status board or operator panel you want, paste the prompt the symbol gives you into an AI chat your company allows, and paste the answer back. The result runs on live PI data inside your display, with no programming on your side.

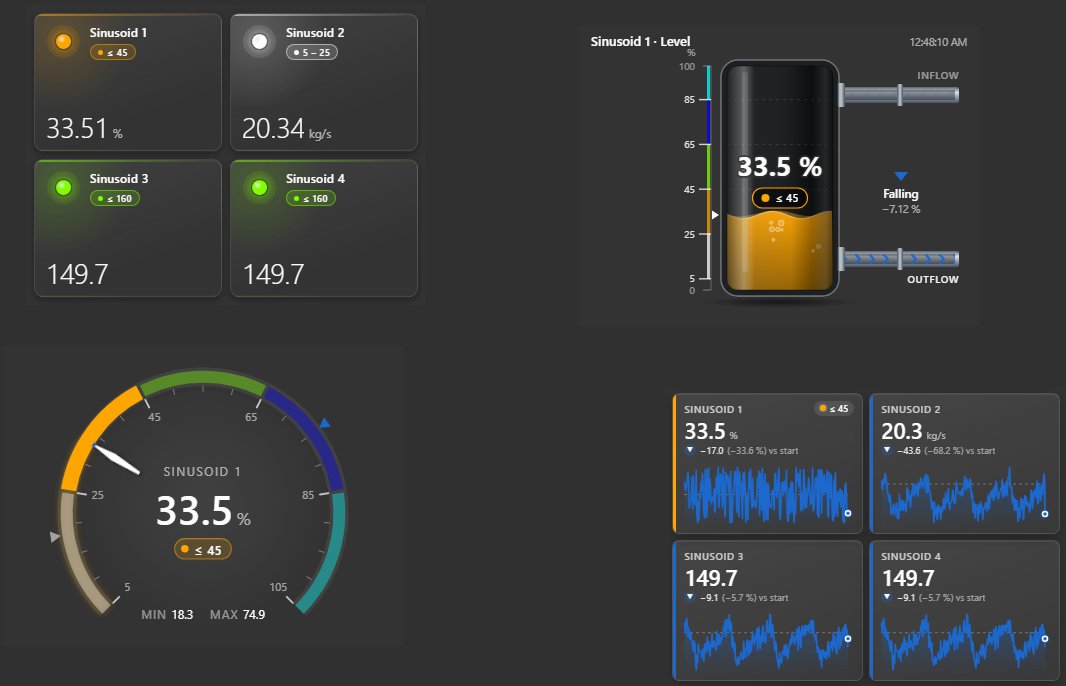
Custom Visualization+ documents on one AVEVA PI Vision display: four status cards, a tank with inflow and outflow pipes showing 33.5 percent, a half-round gauge and four trend cards for Sinusoid 1 to 4
Status cards, a tank, a gauge and trend cards, each a Custom Visualization+ document on live PI data. Demo data. Select the image to enlarge.

Build a custom PI Vision visualization with AI

You describe what you want to see. The symbol hands you a prompt that already knows your data sources, so an AI can answer with a finished document.

Copy the AI prompt, paste the answer, check the preview

The code editor shows the result before anything changes on your display.

  • Copy AI prompt gives you instructions with the labels, units, states, limits and theme of your symbol, ready to paste into an AI chat.
  • Run shows the AI’s answer live in the preview, and Output lists any errors.
  • Apply puts the visualization on the display once you are happy with it.
  • Copy error report packages the document and its output, so the AI can fix a problem.
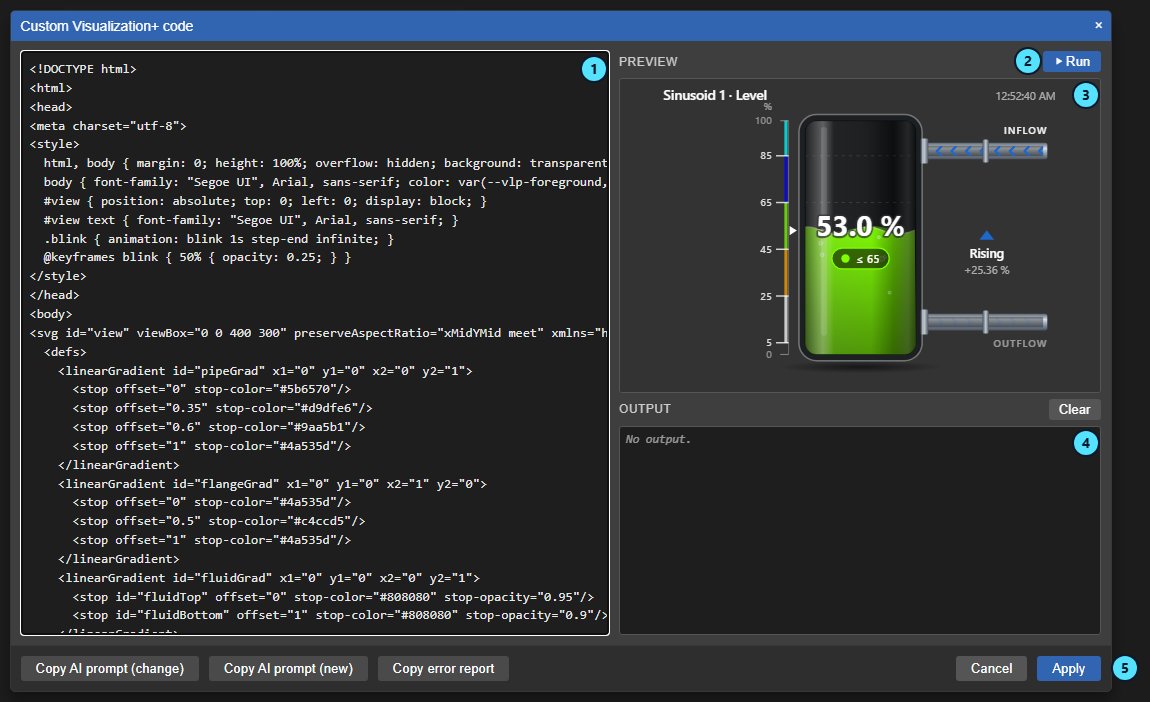
The Custom Visualization+ code editor with the document code on the left, the preview of a tank on a live level value, the Output panel, and the Copy AI prompt (change), Copy AI prompt (new), Copy error report, Cancel and Apply buttons
The code editor: document, preview, output and Apply. Demo data. Select the image to enlarge.

Tanks, trends, tables and status views from a plain description

Ask for the view your operators need, then change it one request at a time.

  • Name your data sources by position or label and say what to show and over which period.
  • Ask for values with quality, trends, time in state, statistics over a period, tables and heat maps.
  • Copy AI prompt (change) sends the current document along with your next request.
  • Documents load no outside resources, so graphics are drawn directly instead of using external images or fonts.
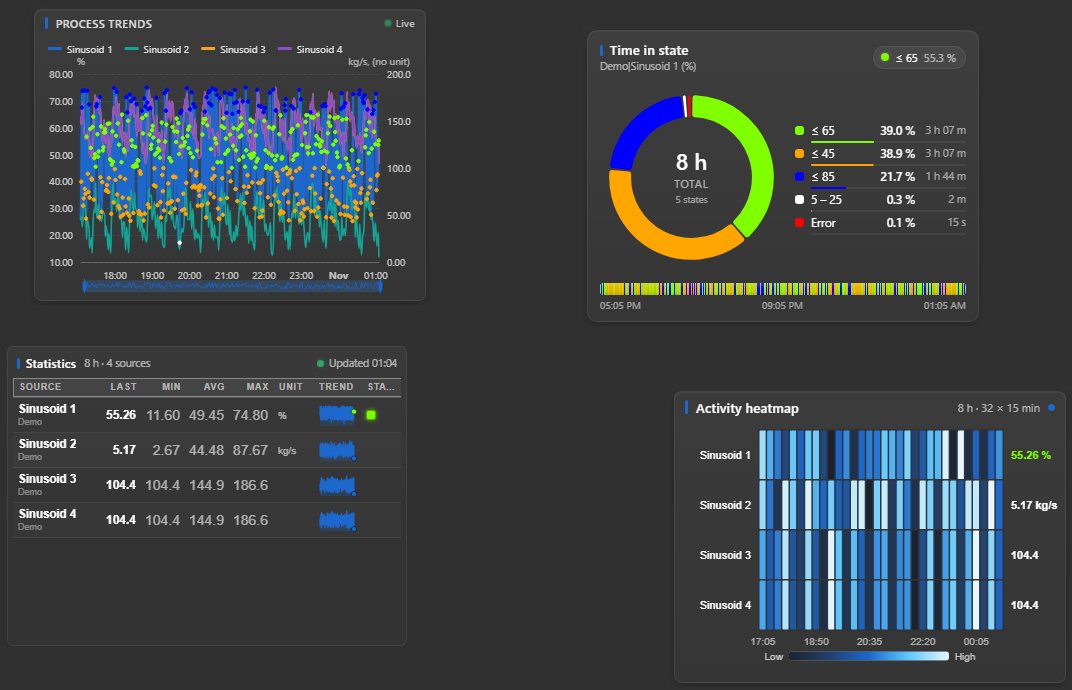
Four AI-written Custom Visualization+ documents: a process trends chart with four series, a time in state ring chart, a statistics table with last, minimum, average and maximum values, and an activity heatmap
A trend chart, a time-in-state ring, a statistics table and a heat map, written by an AI from a description. Demo data. Select the image to enlarge.

Reuse one visualization across displays and assets

Write the visualization once, then place it wherever the same view is needed.

Parameters per symbol

Titles, limits, decimals and colours can be set per placement, without opening the code.

  • The document declares the settings it offers, such as text, number, toggle, list or colour.
  • Each symbol on the display gets its own values in the Parameters group.
  • A reset restores the defaults the document ships with.
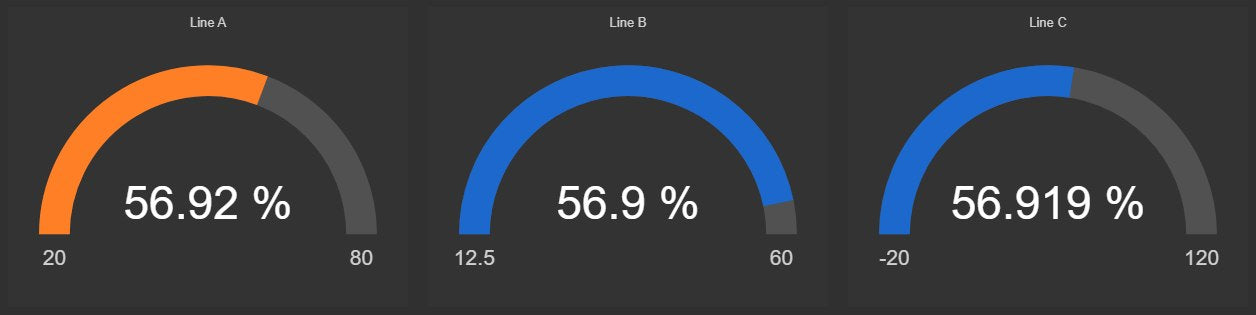
  • One document can serve three lines, each with its own title and range.
Three Custom Visualization+ gauges from one document titled Line A, Line B and Line C, with different ranges 20 to 80, 12.5 to 60 and minus 20 to 120 and different colours and decimals
One document, three gauges with their own titles and limits. Demo data. Select the image to enlarge.

Store the visualization in an AF attribute

Keep the document in AF, so a change reaches every display that uses it.

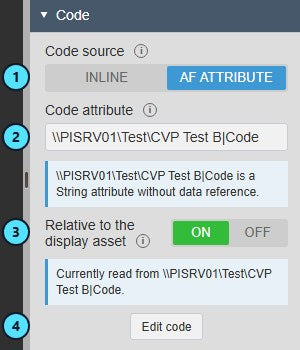
  • Choose an AF attribute as the code source instead of storing the document in the display.
  • Read it relative to the display asset, so each asset can use its own document.
  • Save to AF writes the edited document back, after a confirmation.
  • Larger documents than the inline limit can live in AF.
The Code group of Custom Visualization+ with Code source set to AF attribute, the code attribute path, Relative to the display asset switched on and the Edit code button
Code source set to an AF attribute. Select the image to enlarge.

Interactive PI Vision visualizations that zoom, filter and write

A visualization can do more than show values: it can steer other parts of the display, and with your permission it can let operators write.

Click to set the time range or filter other symbols

Let a click on a bar, a point or a card change what the rest of the display shows.

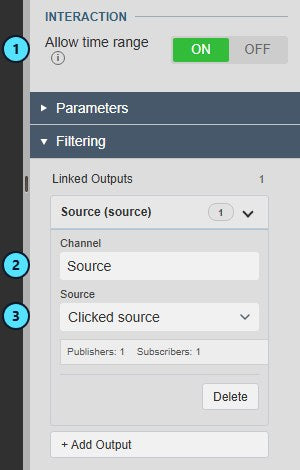
  • Allow time range lets the document zoom the display to a period.
  • Linked outputs publish a selection, such as a clicked source, on a channel.
  • Linked inputs in other symbols filter themselves to that selection.
  • The selection can be cleared again from the visualization.
Custom Visualization+ settings with Allow time range switched on and a linked output with the channel Source and the source Clicked source
Allow time range and a linked output. Select the image to enlarge.

Operator panels that write values to PI

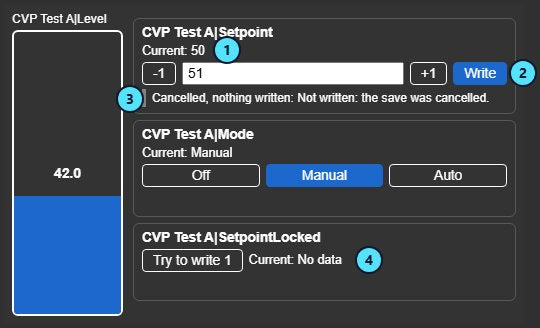
Build buttons and entry fields for set points and modes, and keep every write behind a confirmation.

  • Writing is off until you switch on Allow writes for the symbol.
  • With Confirm every write on, operators see a Write values dialog and choose Confirm or Cancel.
  • Optional limit checks on numeric sources can stop values outside a range.
  • Operators still need write permission on the PI points or AF attributes.
A Custom Visualization+ operator panel with a level bar, a set point entry field with minus one and plus one buttons and a Write button, a Manual, Auto and Off mode selector, and numbered callouts
An operator panel with a set point field and a mode selector. Demo data. Select the image to enlarge.

Custom PI Vision visualization examples

Four views teams can ask an AI for and run on their displays.

Process tank

Data
A level point with its limits
Settings
Description of the tank, the level states and units, then Run and Apply
Shows
A tank that fills and changes colour with the level, on the operator display

Status board

Data
Several PI points or AF attributes
Settings
Cards per source with value, state and a short trend, titles set as parameters
Shows
One view of all units, reusable on other assets

Trend explorer

Data
A few sources over the display period
Settings
Allow time range, a click that zooms the display to a period
Shows
A chart that moves the whole display to the period an engineer selects

Set point panel

Data
A set point and a mode attribute
Settings
Allow writes, Confirm every write on, write permission for the operators
Shows
A panel where operators change the value after the Write values dialog

Watch Custom Visualization+ in action in PI Vision

A walkthrough on a PI Vision display: ask an AI for a tank on a live PI point with the prompt the symbol provides, run and apply it, refine it with one more request, set parameters per symbol, and write a set point after the confirmation dialog.

Custom Visualization+ product demo. Demo data.

Custom Visualization+ FAQ

Questions we are asked most often. Read the Custom Visualization+ documentation or ask a technical question.

Does Custom Visualization+ include an AI?

No. The symbol gives you a prompt, with the labels, units, states, limits and theme of your symbol, to paste into an AI chat. You paste the AI’s answer back into the code editor. Use an AI that your company allows.

How do we know the AI’s visualization is right?

Run it first. The preview shows the document on the live data of your sources, Output lists errors, and nothing changes on the display until you choose Apply. The preview never writes. Check the numbers against a trusted display, and use Copy error report or Copy AI prompt (change) to ask the AI for corrections. Software Athlete supports the symbol and its interface, not the code of individual documents.

Can a visualization write values to PI?

Only if you allow it. Writing is off until Allow writes is switched on for the symbol, Confirm every write shows a Write values dialog before each write, and operators need write permission on the PI points or AF attributes. Administrators can also limit who may edit code and block writes for the whole site.

What can a visualization use as data?

Any PI point or AF attribute you add as a data source of the symbol. A document reads and writes only its own data sources and loads no outside resources, so graphics and styling are part of the document itself.

What do we need to run it?

Vision Library+ 2.2 with PI Vision 2021 or later and PI Web API, and PI AF Server 2018 SP2 or later. Your PI Vision administrator installs the Vision Library+ frames folder; without it the symbol stays empty. Storing a document in AF needs a String attribute without a data reference and AF write permission.

How do we get Custom Visualization+?

Custom Visualization+ is part of Vision Library+, together with the other Vision Library+ symbols. Request a trial to test it in your own PI Vision environment.

Try Custom Visualization+ in your PI Vision

Custom Visualization+ is included in Vision Library+, the PI Vision custom symbol library from Software Athlete. Test it on your own displays and data.