Asset Analytics Chart+ for AVEVA PI Vision

PI Vision chart of AF assets by mode, template or state

Total, average or count an attribute across many assets and see it as a bar, line or area chart. Asset Analytics Chart+ works on the current values of the assets you choose, compared side by side, not over time.

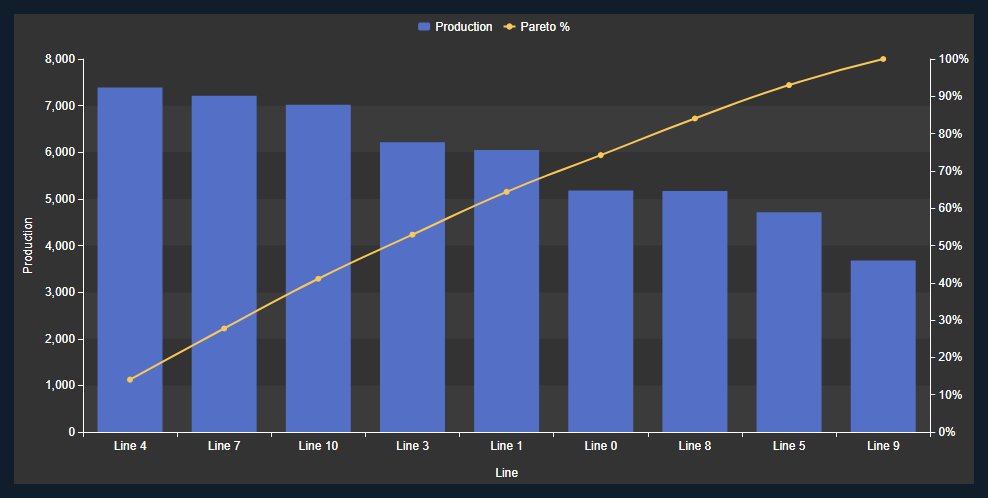
Asset Analytics Chart+ in PI Vision with the production of nine assembly lines as bars sorted from highest to lowest, Line 4 first, and a Pareto line with the cumulative percentage on a right axis from 0 to 100 percent
Asset Analytics Chart+ in PI Vision: the production of nine assembly lines with a Pareto line. Demo data. Select the image to enlarge.

PI Vision bar chart for a set of AF assets

Pick the assets once, choose what to measure, and get one bar for every asset or category in your PI Vision display.

Total, average or count an attribute per asset

Each bar summarises the current value of an attribute for one asset, so one symbol answers how much and how many right now across a whole fleet.

  • Assets from a fixed selection or from an asset search by database, root and template.
  • Count, Count Distinct, Sum, Min, Max, Average, Median and Standard Deviation.
  • Several values in one chart, each shown as a bar, line, area or scatter, on the left or a secondary axis.
  • Horizontal bars, data labels, reference lines and the display themes.
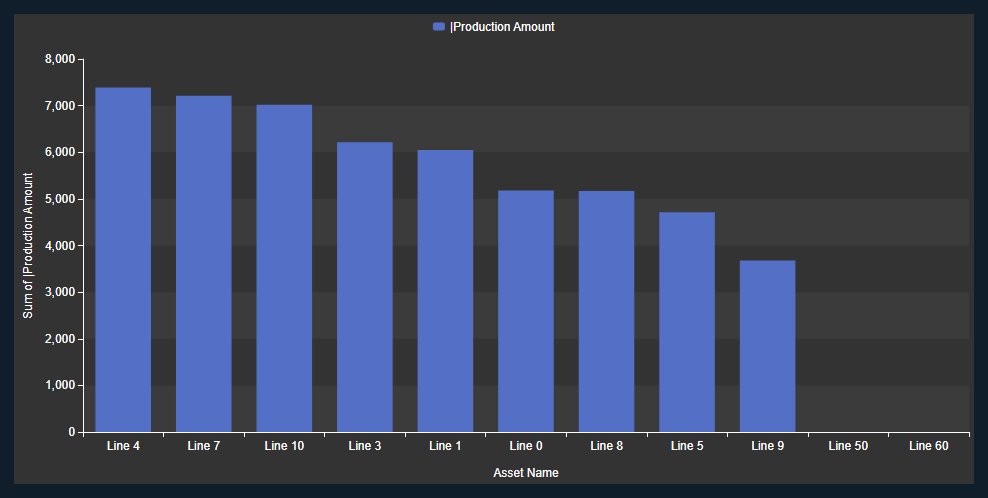
Asset Analytics Chart+ with one bar per assembly line showing the sum of the production amount, Line 4 the highest, with the legend and the value axis named Sum of Production Amount
The sum of the production amount for each assembly line. Demo data. Select the image to enlarge.

One bar per operating mode, template or state

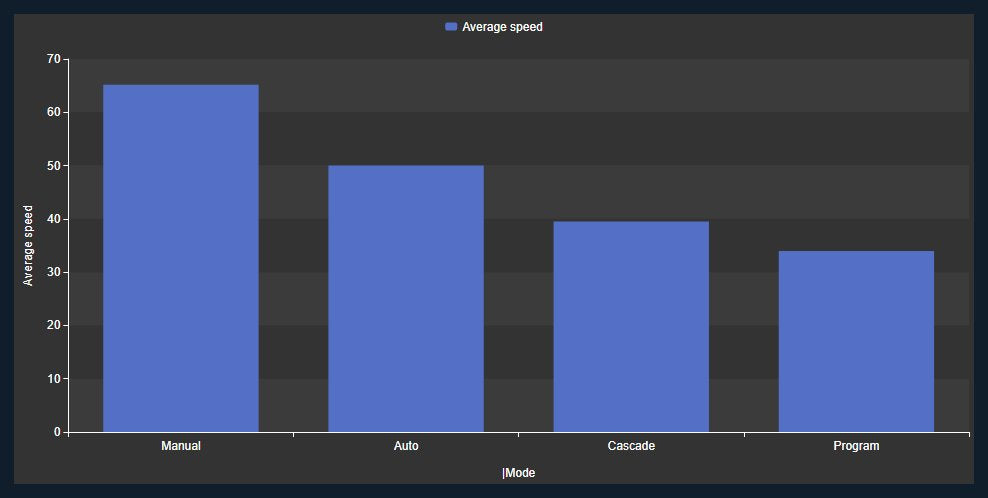
Group the assets by any attribute and each bar summarises every asset in that category, such as the average speed of the lines in each operating mode.

  • Group by an attribute, the asset name, the template name or other asset properties.
  • Several arguments combine into one category, and date attributes group by day, week, month, quarter or year.
  • Bars sorted ascending or descending, by the category or by a value.
  • A title for each value and argument for the legend and the axes.
Asset Analytics Chart+ with the average speed of the assembly lines in each operating mode as bars, Manual highest, then Auto, Cascade and Program
The average speed of the lines in each operating mode. Demo data. Select the image to enlarge.

Split, stack and rank PI Vision asset charts

See what each bar is made of, and keep the biggest contributors in view without losing the total.

Split every bar by a second attribute

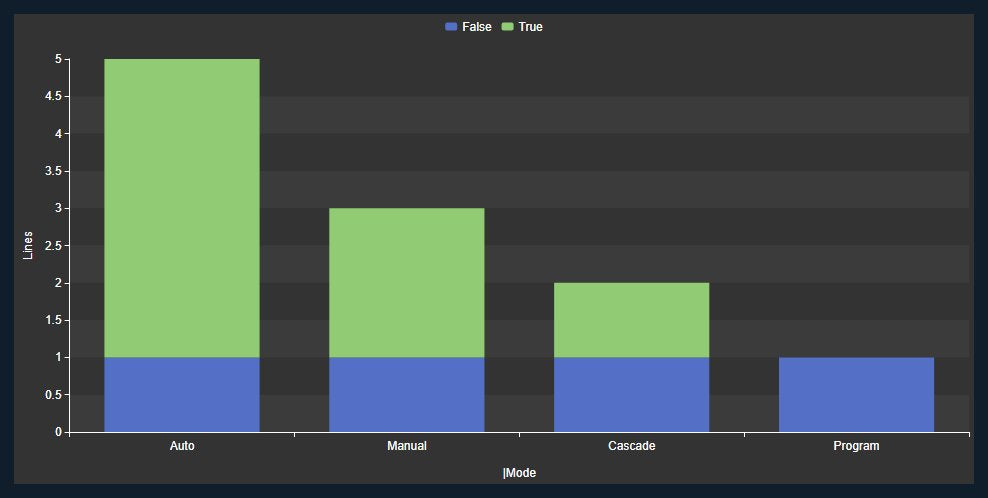
Add a series and each bar breaks down by a second attribute, for example how many lines in each mode are active.

  • One colour and legend entry for every value of the series attribute.
  • Parts side by side, stacked, or stacked to 100 percent.
  • Several series nest as drilldown levels.
  • Custom colours for the series values.
Asset Analytics Chart+ with stacked bars for the operating modes Auto, Manual, Cascade and Program, each split into active and inactive assembly lines with a legend entry for False and True
The number of lines in each operating mode, split by whether the line is active. Demo data. Select the image to enlarge.

Top N with an Others bar and a Pareto line

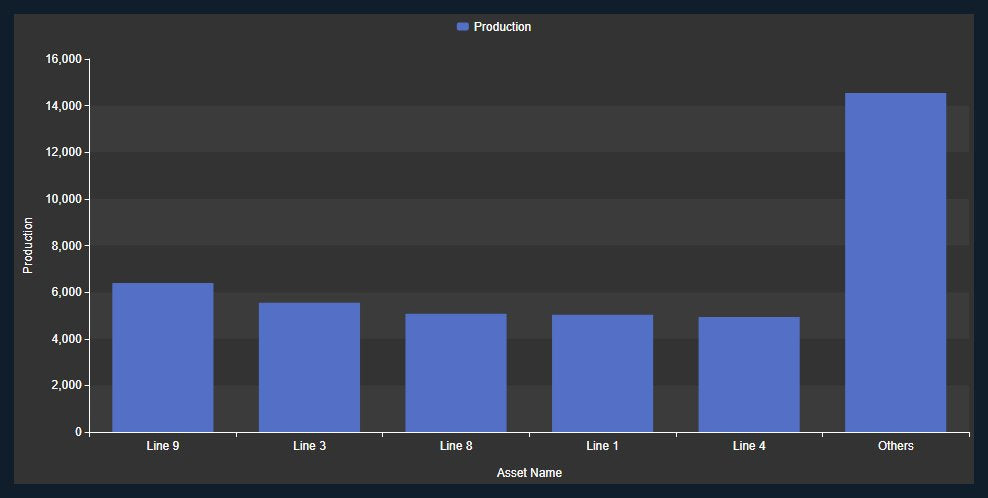
Show only the largest or smallest assets and still keep the total in view, then add a cumulative line to see which assets make up most of it.

  • Top or Bottom N, ranked by any of the values.
  • An Others bar sums all the remaining assets.
  • A Pareto line with the cumulative percentage against a second axis.
  • Sort by the category or by a value.
Asset Analytics Chart+ with bars for the five assembly lines with the highest production, Line 9, Line 3, Line 8, Line 1 and Line 4, and an Others bar with the production of all remaining lines on the right
The five lines with the most production and an Others bar for the rest. Demo data. Select the image to enlarge.

Filter PI Vision displays and inspect the assets behind a bar

Let a click on a bar narrow the rest of the display, and see exactly which assets stand behind each number.

Click a bar to filter other asset symbols

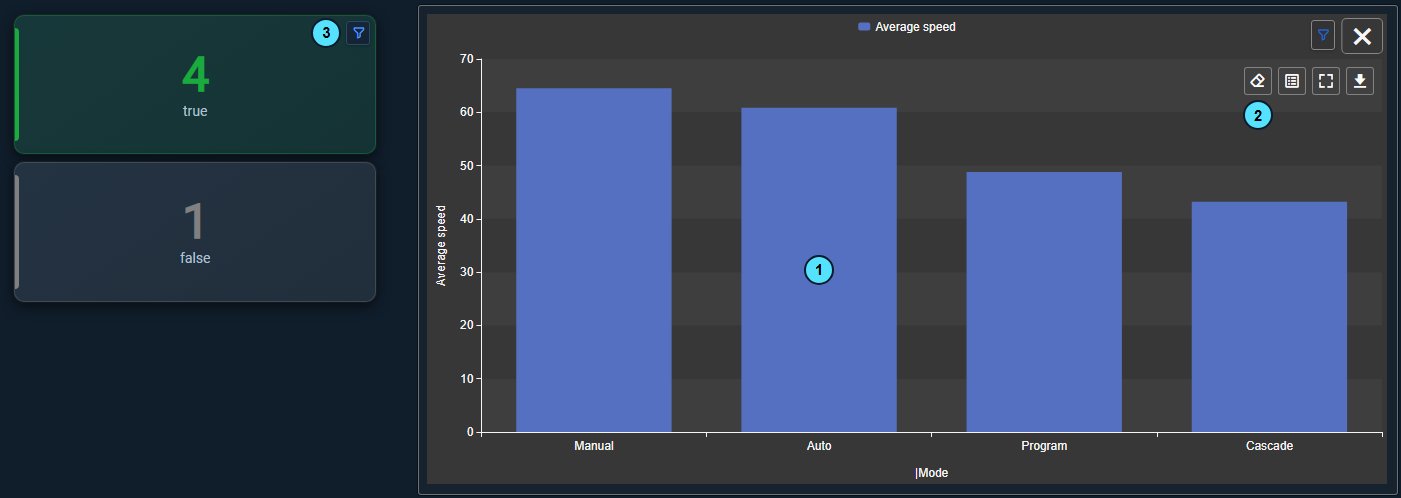
Use the chart as the entry point of a dashboard: a click narrows the other asset symbols to the assets of that category.

  • Click Action None, Drilldown or Filter.
  • Filter output as Master, Linked or both, so other symbols follow the click.
  • The chart follows filters from Asset Filter+ and other asset symbols, with a filter icon and Clear Filter in its toolbar.
  • Ignore Master keeps the chart unaffected by master filters.
Asset Analytics Chart+ next to two Asset Analytics KPI+ cards after a click on a bar: the cards count only the four active and one inactive lines of the chosen operating mode and show a filter icon, while the chart keeps all its bars and shows the Clear Filter button in its toolbar
After a click on a bar, the KPI cards next to the chart recalculate for that mode. Demo data. Select the image to enlarge.

Inspect Data: the assets behind each bar

Open the numbers behind the chart and the list of assets that make up a bar, without leaving the display.

  • A Summary tab with one row per bar: category, series and value.
  • A Rows tab with the assets of the selected row and their attributes.
  • Export of the tab you are viewing as CSV, JSON or XLSX.
  • Fullscreen view and image or data downloads from the chart toolbar.
The Inspect Data dialog of Asset Analytics Chart+ on its Rows tab with five of eleven assembly line assets and their attributes, with the time of the data and the Refresh, CSV, JSON and XLSX buttons
The assets behind the Auto bar: five of eleven assets, with CSV, JSON and XLSX export. Demo data. Select the image to enlarge.

PI Vision asset chart examples

Four common ways teams use Asset Analytics Chart+ in their displays.

Production by line

Data
A production attribute on every assembly line
Settings
Value Sum of the production attribute, Argument Asset Name, Top N 5 with Others and Pareto
Shows
Which lines make up most of the output

Speed by operating mode

Data
A speed attribute and a mode state on every line
Settings
Value Average of the speed, Argument the mode attribute
Shows
How each operating mode performs

Active assets per state

Data
A status attribute and an active flag on every asset
Settings
Value Count of the asset name, Argument the status, Series the active flag, stacked
Shows
How many assets are active in each state

Fleet drilldown dashboard

Data
Several asset symbols on one display
Settings
Click Action Filter with Output Mode Master
Shows
One click narrows the KPI cards and tables next to the chart

Watch the PI Vision asset chart in action

A captioned tour of Asset Analytics Chart+ on eleven assembly lines: values, arguments, series, a second value, Top N with Pareto, a click filter and Inspect Data.

Asset Analytics Chart+ product demo. Demo data.

Asset Analytics Chart+ FAQ

Questions we are asked most often. Read the Asset Analytics Chart+ documentation or ask a technical question.

Does it chart values over time?

No. Each asset contributes its current attribute value, and the chart summarises those values across the assets by category. It does not aggregate an attribute over the display time range. For a time-based answer, such as an average over the last shift, use an AF analysis or Asset Time Series Chart+.

How is it different from Asset Comparison Bar Chart+ and Asset Analytics KPI+?

Asset Analytics Chart+ summarises many assets into bars by category, such as the total production per operating mode. Asset Comparison Bar Chart+ compares the attribute values of each asset side by side. Asset Analytics KPI+ shows the same kind of result as KPI cards. For Event Frames, use Event Analytics Chart+.

Are new assets included automatically?

Yes, if the chart uses an asset search instead of a fixed set of assets. New assets that match the search by database, root and template are included, up to the number of results you set.

Can a click on a bar filter the rest of the display?

Yes. With Click Action Filter, a click makes the other asset symbols, such as Asset Analytics KPI+, recalculate for the assets of that category. The chart also follows filters from Asset Filter+ and other asset symbols.

What do we need to run it?

Vision Library+ 2.2 with PI Vision 2021 or later, PI Web API and PI AF Server 2018 SP2 or later. Asset Analytics Chart+ runs in PI Vision and uses each user’s existing PI permissions.

How do we get Asset Analytics Chart+?

Asset Analytics Chart+ is part of Vision Library+, together with the other Vision Library+ symbols. Request a trial to test it in your own PI Vision environment.

Try Asset Analytics Chart+ in your PI Vision

Asset Analytics Chart+ is included in Vision Library+, the PI Vision custom symbol library from Software Athlete. Test it on your own displays and data.