



Asset Analytics Chart+
Asset Analytics Chart+ turns a set of AF assets into a bar, line, or area chart. Count the assets or total an attribute such as production for each asset, mode, or template, split the bars by a second attribute, and let readers click a bar to filter the rest of the display.
Overview
Watch the demo
See Asset Analytics Chart+ in a practical PI Vision workflow.
When to use it
Use Asset Analytics Chart+ when you need to:
- Total, average, or count an attribute across many assets, with one bar per asset or per category.
- Compare categories such as operating modes, templates, or states.
- Split each bar by a second attribute, such as whether a line is active.
- Keep the largest assets and group the rest as Others.
- Let readers click a bar to filter the other asset symbols on the display.
Choose Asset Analytics KPI+ when the same results should appear as KPI cards. Choose Asset Comparison Bar Chart+ to compare the attribute values of each asset side by side. Choose Event Analytics Chart+ when the chart should summarize event frames.
Before you begin
- Prepare the AF assets: either a fixed set of elements, or an asset search by database, root, and template.
- For a sum, average, minimum, maximum, median, or standard deviation, use a numeric attribute. Text, Boolean, and date attributes offer only Count and Count Distinct.
- Each asset contributes its current value. The chart does not aggregate an attribute over the display time range.
- To group assets by month or year, you need a date attribute.
- For a click that filters other symbols, add asset symbols such as Asset Analytics KPI+. See Filtering dashboards.
Add and set up the symbol
- Select Asset Analytics Chart+ in the PI Vision symbol gallery.
- In the Assets pane, find an asset such as Line 1 and drag it onto the display. The chart shows one bar that counts the asset.
- Right-click the symbol and select Add Dynamic Search Criteria.... The chart now shows one bar for each asset with the same template under the same root.
- Right-click the symbol and select Configure Asset Analytics Chart....
- Under Dimension, open Values and set Value to an attribute such as |Production Amount.
- Set Summary to Sum.
The chart shows one bar per assembly line with its production, largest first. The legend and the value axis name the value. Enter a Title in Values to rename it.
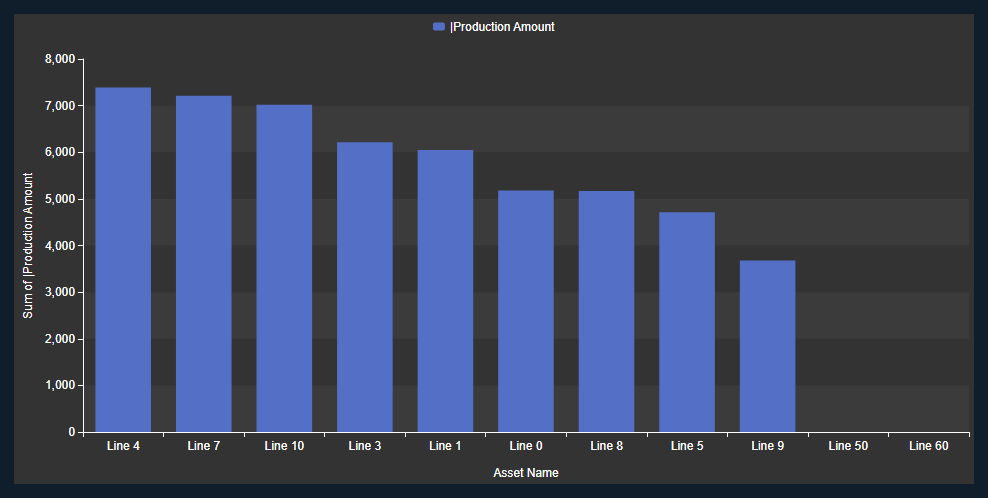
Note: Attribute names show a leading | in the Value lists. Asset properties such as Asset Name and Template Name have none. A state attribute also offers its levels, such as |Mode|Level1.
Common tasks
Total or average an attribute by category
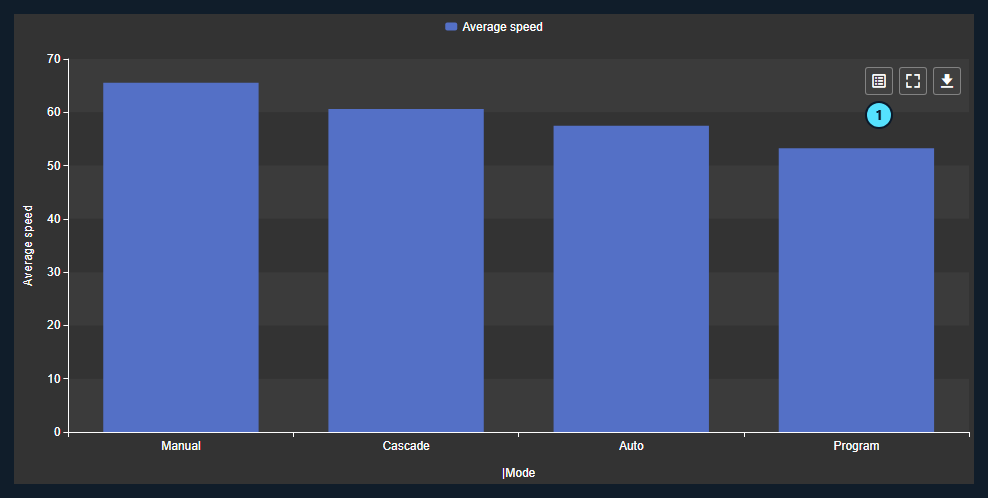
Use this when the bars should show categories, such as the average speed of the lines in each operating mode.
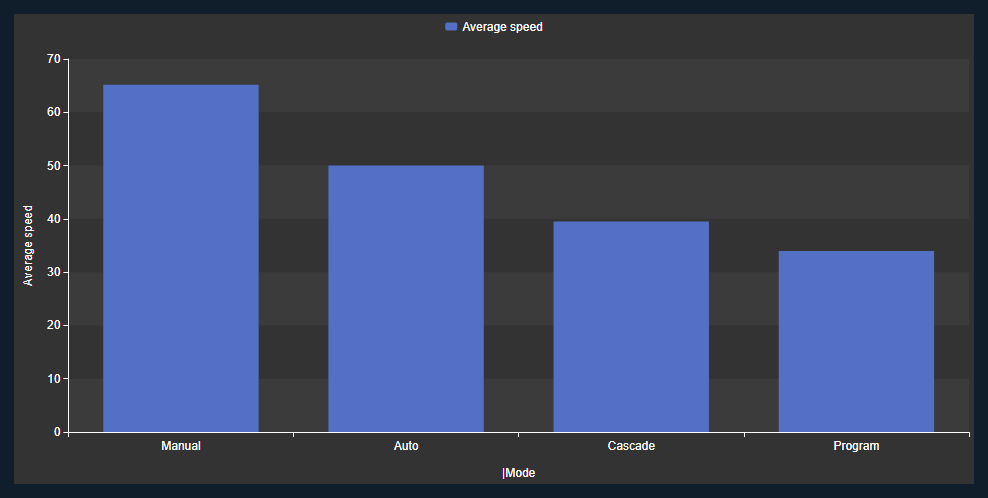
- In the configuration pane, open Values. Set Value to |Speed, Summary to Average, and Title to Average speed.
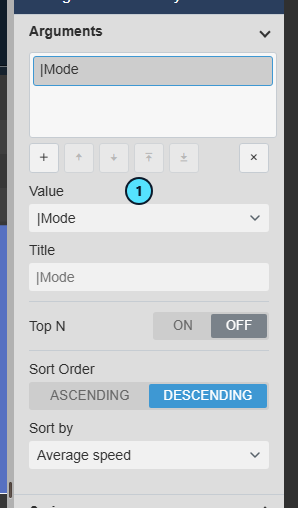
- Open Arguments and select the argument.
- Set Value (1) to the attribute that defines the bars, for example |Mode.
The chart shows one bar per mode with the average speed of its lines. Sort Order and Sort by decide the order of the bars.
Split the bars by a second attribute
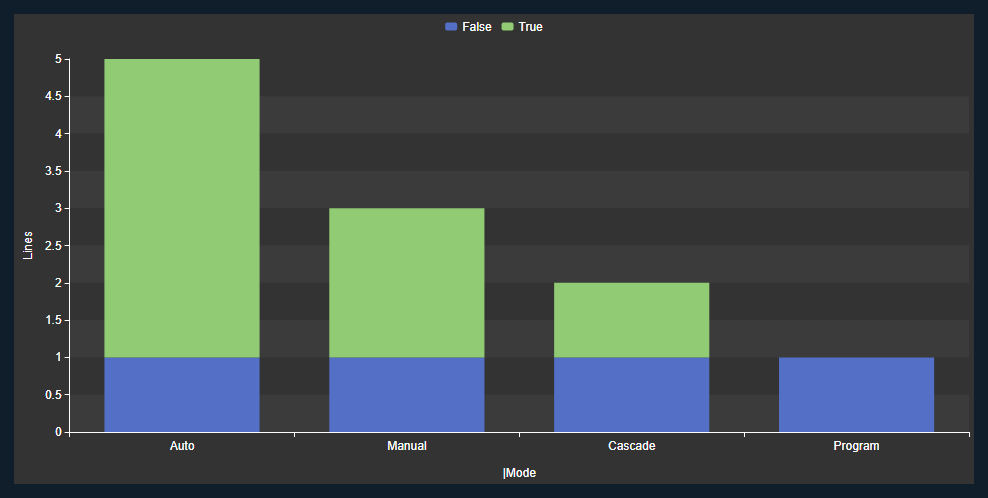
Use this when you want to see what each bar is made of, for example how many lines in each mode are active.
- In Values, set Value to Asset Name, Summary Type to Count, and Title to Lines.
- Select the second Stack button to stack the parts of each bar.
- Open Series and select +.
- Set Value (1) to the attribute that splits the bars, such as |Active.
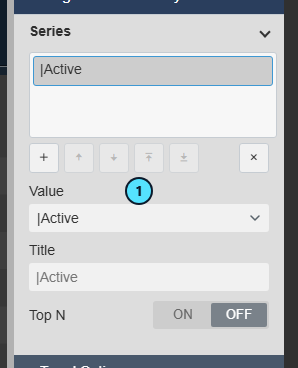
Each bar is now split by the series value, with a color and a legend entry per value. The first Stack button places the parts side by side, and the third stacks them to 100 percent.
Show only the largest assets
Use this when the chart has more assets than fit.
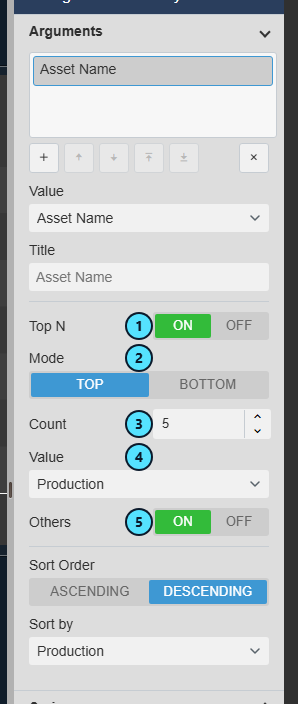
- In Arguments, set Value to Asset Name.
- Set Top N (1) to ON and Mode (2) to Top. Select Bottom for the smallest.
- Enter the Count (3), for example 5.
- Set the ranking Value (4) to the value that decides the ranking.
- Leave Others (5) ON to add one bar that sums all remaining assets.
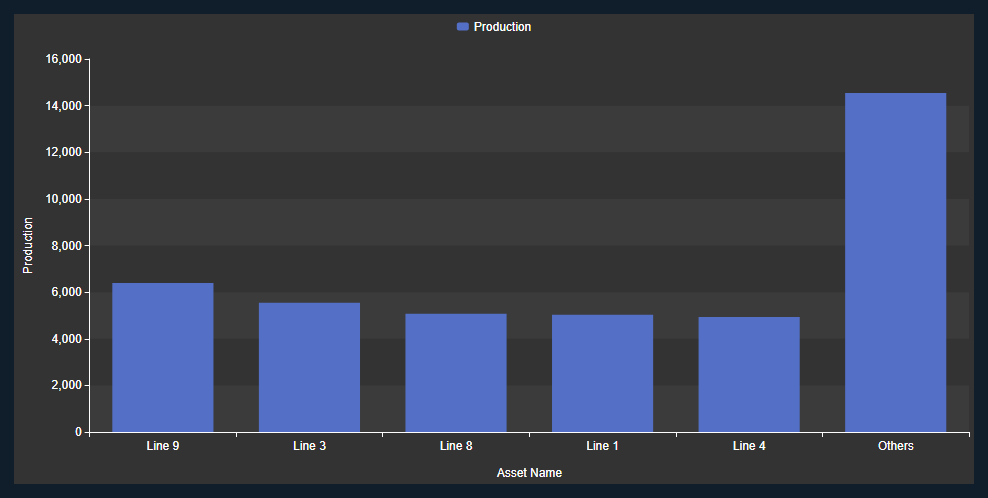
The chart keeps the five largest assets and adds an Others bar at the right.
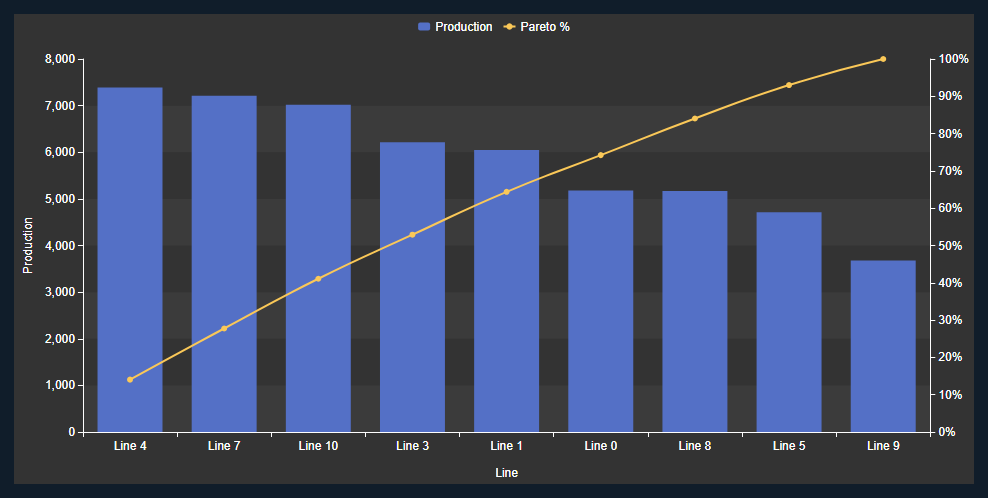
To see which assets make up most of the total, open Pareto Analysis under Trend Options and set Enabled to ON. A line then shows the cumulative percentage against a second axis, as in the first image of this article.
Change the assets with search criteria
Use this when the assets come from a search, and you want a different set.
- Right-click the symbol and select Search Criteria.... A symbol with a fixed set of assets offers Add Dynamic Search Criteria... instead, which replaces the fixed set.
- Narrow the search with Search Root (1), Asset Name (2), Asset Type, or Asset Category. Asset Name accepts wildcards such as
Line 1*. - Set Number of Results (3) to the most assets you want. The default is 16.
- Select Refresh (4).
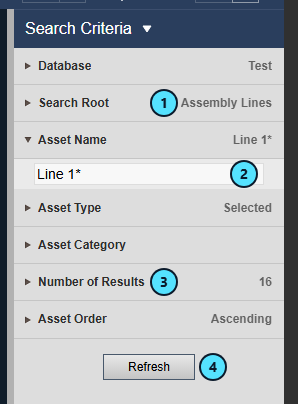
The chart recalculates for the new set. Each symbol keeps its own search.
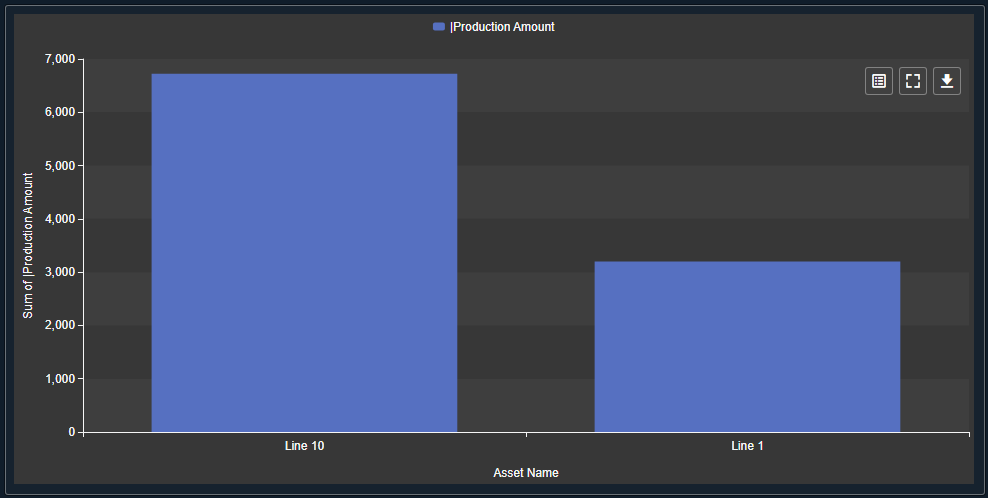
Filter the display with a click
Use this when a click on a bar should narrow the other asset symbols on the display.
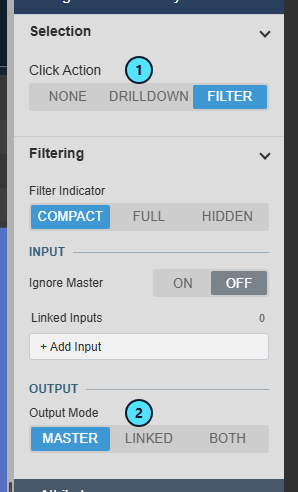
- In the configuration pane, open Interactivity > Selection and set Click Action (1) to Filter.
- Open Filtering and set Output Mode (2) to Master to filter every symbol that listens to Master filters. Linked and Both publish to named channels. See Filtering dashboards.
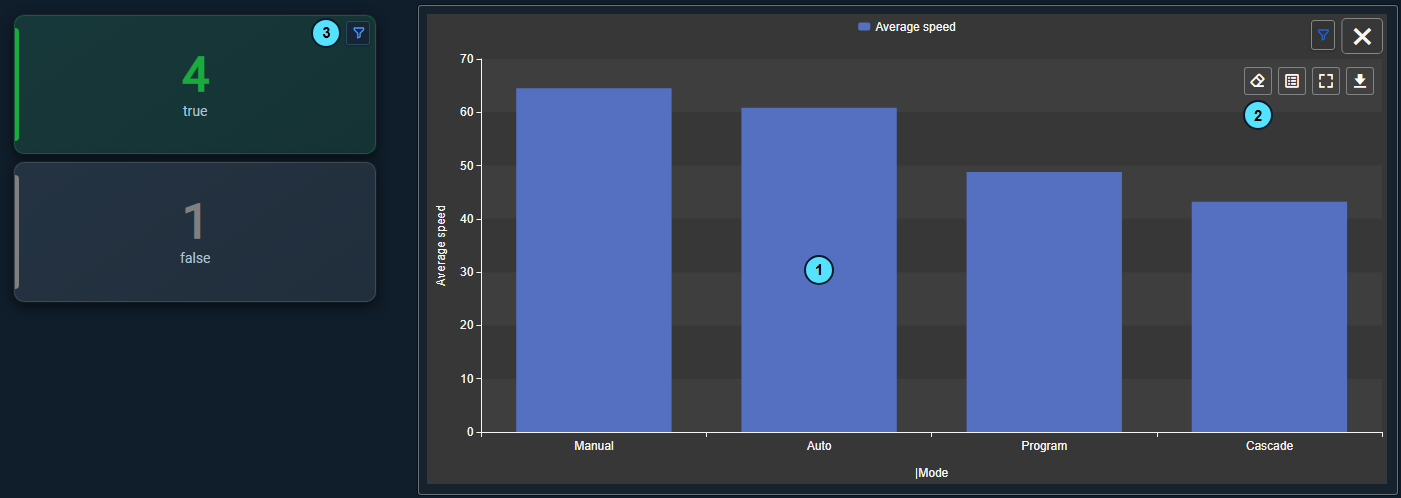
A click on a bar (1) makes the other asset symbols recalculate for the assets of that category. Here the Asset Analytics KPI+ cards count only the lines in Auto mode and show a filter icon (3). The clicked chart keeps all its bars. Select Clear Filter (2) in its toolbar to remove the filter.
The chart also follows filters from other symbols. When you select entries in an Asset Filter+, the bars recalculate for the matching assets.
Check the assets behind a bar
Use this when a reader asks which assets make up a bar, or needs the numbers in a spreadsheet.
- Hover the chart and select Inspect Data (1) in its toolbar.
The dialog opens on the Summary tab, with one row for each bar: the category, the series, and the value.
- Select a row, for example Auto.
- Select the Rows tab (1). It lists the assets behind that row with their properties and attributes. The count (2) shows 5 of 11 assets.
- To keep the data, select CSV, JSON, or XLSX (4). The file holds the tab you are viewing.

Data as of (3) shows when the dialog read the chart, and Refresh reads it again. The attribute values change while the dialog is open, so refresh before you compare it with the chart. Select the same Summary row again to see all assets.
Use the symbol
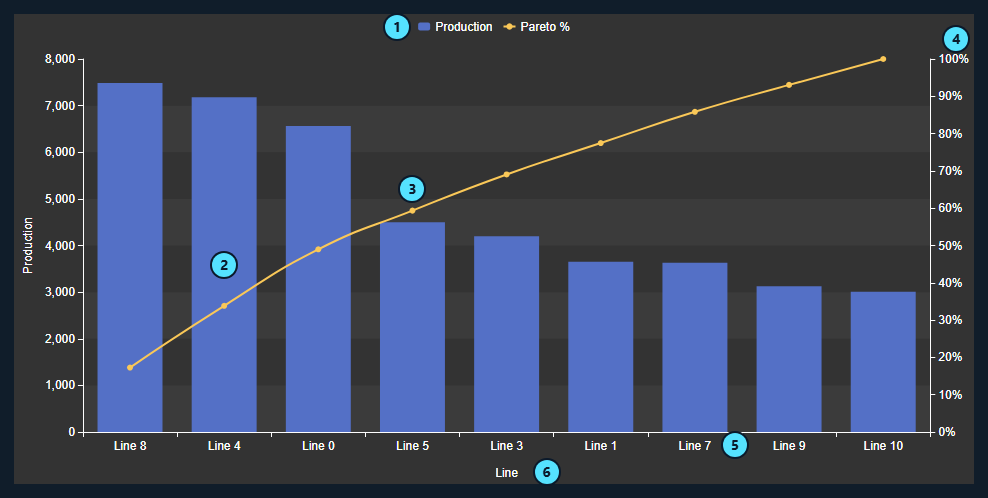
| What it shows | |
|---|---|
| (1) | The legend. One entry per value, or per series value when the chart has a series. |
| (2) | A bar. Its height is the count or the total of the assets in that category. |
| (3) | A point on the Pareto line, the cumulative share of the total up to that bar. |
| (4) | The right axis of the Pareto line, from 0 to 100 percent. |
| (5) | A category. With several arguments, the label combines their values. |
| (6) | The argument axis title. |
- Hover a bar to see its category and summary values. Pointer in the Tooltip group adds a guide to the axis.
- Click a bar to do what Click Action says: nothing, drill down, or publish a filter. A click never writes to the PI System.
- Toolbar: hover the chart to show its buttons at the top right. Inspect Data shows the numbers and the assets behind the chart, see Check the assets behind a bar. Clear Filter shows while a click on this chart filters the display or has drilled down, and clears that filter or drill-down. Fullscreen opens the chart at the size of the display. Download offers images and data files with one row for each bar. Your administrator can hide the data formats and the export buttons of Inspect Data.
- Filters: an Asset Filter+ or another asset symbol narrows the assets and a filter icon appears. Ignore Master keeps the chart unaffected.
- Asset without a value: an asset that has no value for the attribute keeps its category on the axis without a bar, and adds nothing to a sum or average.
Configure the symbol
Right-click the symbol and select Configure Asset Analytics Chart.... The right-click menu also offers Search Criteria... (or Add Dynamic Search Criteria... for a fixed set of assets) and Add Multi-State.... The groups appear in this order.
Dimension > Values
One entry for each number the chart plots. Use + to add one and the arrows to reorder.
| Setting | What it does |
|---|---|
| Value | The property or attribute to summarize. Properties are Asset, Asset Name, Description, Template Name, Path, and Has Children. |
| Summary | Count, Count Distinct, Sum, Min, Max, Average, Median, or Standard Deviation. Text, Boolean, and date values show Summary Type with Count and Count Distinct. |
| Title | Names the value in the legend and on the axis. |
| Show | OFF hides the value but keeps it for ranking and sorting. |
| Type | Bar, Line, Area, or Scatter. A line also offers Style, Width, and Stepped. |
| Stack | Side by side, stacked, or stacked to 100 percent. Used in Split the bars by a second attribute. |
| Axis Y | Plots the value on the left axis or on the secondary axis. Use the secondary axis for a value with another scale. |
| Show (labels) | The second Show, below Axis Y, prints this value on its marks. Series adds the series name. |
| Lines | Adds fixed reference lines, each with a label, value, color, width, and style. |
Dimension > Arguments and Series
Both groups offer the same settings. Several arguments combine into one category. Several series nest as drill-down levels.
| Setting | What it does |
|---|---|
| Value | The property or attribute that defines the bars (arguments) or the colors (series). Used in Total or average an attribute by category. |
| Group Interval | Available for date attributes. Groups by Day-Month-Year, Month-Year, Week-Year, Quarter-Year, Year, Day of Week, and other intervals. |
| Title | Names the argument or series in the axis and the list. |
| Top N | Keeps the top or bottom entries. Mode, Count, Value, and Others set the details. Used in Show only the largest assets. |
| Sort Order, Sort by | Arguments only. Order the bars ascending or descending, by the category or by a value. |
Trend Options
| Group | What it does |
|---|---|
| Title | Shows a title and a sub title. |
| Style | Theme, Surface, Container Style, Apply to all symbols, Font Size, and Orientation. Horizontal turns the bars sideways. |
| Grid | Show, the grid Lines, alternating Bands, and the Border of the plot (Axes, Frame, None). |
| Data Labels | Labels on all marks: Show, Position, Name, Value, Background, and Font Size. |
| Tooltip | Show and the Pointer guide (None, Argument, Cross). |
| Toolbar | Show Toolbar turns the toolbar with Inspect Data, Clear Filter, Fullscreen, and Download on or off. On by default. Reveal shows it On Hover or keeps it in view Always. |
| Legend | Enabled, Position, Placement (Outside, Inside), Alignment, and whether the Color shows as a Marker or as Text. |
| Pareto Analysis | Enabled, Value, Color, Data Labels. Draws the cumulative percentage line of the first image of this article. |
| Axis X | Show, Position (Bottom, Top), and Title. A date argument adds Type (Timeline or Discrete). |
| Axis Y | Show, Position (Left, Right), Invert Scale, Transform (Linear, Logarithmic), Scale Range (Auto, Database, Custom), Title, and Ticks. A secondary axis group appears when a value uses it. |
| Coloring | Auto uses the theme palette. Custom lists every series value and lets you pick its color. |
Interactivity
| Setting | What it does |
|---|---|
| Click Action | None, Drilldown, or Filter. Used in Filter the display with a click. |
| Drilldown | Available when Click Action is Drilldown. Drills through the Argument or Series list. |
| Filter Indicator | Compact shows a filter icon, Full adds the asset count, and Hidden shows nothing. |
| Ignore Master | ON ignores Master filters on the display. Linked inputs still apply. |
| Linked Inputs | Maps a named channel from a publisher to a property of the assets. See Filtering dashboards. |
| Output Mode | Available when Click Action is Filter. Master, Linked, or Both. |
| Linked Outputs | Available with Linked or Both. Maps a property to a named channel. |
Attributes
Current Attributes are the attributes the chart reads for every asset. Additional Attributes are the ones the assets offer but the chart does not read. Use the buttons between the lists to move entries, and the arrows to reorder. Only current attributes appear in the Value lists.
Numbers
The number format for values and labels.
Add Multi-State
Opened from the right-click menu. It colors a value by limits. The editor is the same as in Event Analytics Pivot+. See Color cells by limits.
Troubleshooting and limitations
| Symptom | Cause | What to do |
|---|---|---|
| The chart is empty. | The search found no assets, or no value or argument is set. | Open Search Criteria... and select Refresh, and check Values and Arguments. |
| A category has no bar. | That asset has no value for the attribute. | Check the attribute in AF, or narrow the search. |
| Fewer assets than expected. | The search stops at Number of Results, or a filter from another symbol is active. | Raise Number of Results, clear the filter, or set Ignore Master to ON. |
| Sum and Average are not offered. | The attribute is text, Boolean, or a date. | Choose a numeric attribute. The others offer Count and Count Distinct. |
| Clicking a bar does nothing. | Click Action is None. | Set Click Action under Interactivity > Selection. |
Limitation: The chart reads the current attribute value. For a time-based answer, such as the average over the last shift, use an AF analysis or Asset Time Series Chart+.
Limitation: The properties offered for values, arguments, and series are Asset, Asset Name, Description, Template Name, Path, and Has Children, plus attributes. Element categories and extended properties are not available.


