



Vision Library+ / Charts and analytics
Waterfall Chart+
Waterfall Chart+ shows how sequential positive and negative contributions change a starting value into a final total. Each data source is displayed as either an absolute total or a relative change.
Overview
Waterfall Chart+ shows how sequential positive and negative contributions change a starting value into a final total. Each data source is displayed as either an absolute total or a relative change.
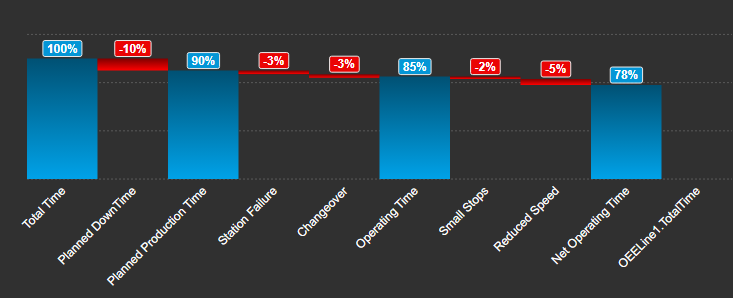
Watch the demo
See Waterfall Chart+ in a practical PI Vision workflow.
When to use it
Use Waterfall Chart+ when you need to:
- Explain how individual gains and losses produce a final result.
- Show an energy, production, cost, or material balance.
- Compare absolute checkpoints with the changes between them.
Use a standard bar chart when the values are independent and do not form a cumulative sequence.
Before you begin
- Prepare one data source for each total or relative contribution.
- Calculate relative values before adding them to the symbol; the chart does not calculate differences between unrelated data sources.
- Order the data sources in the sequence in which the contributions should be applied.
Add and set up the symbol
- Select Waterfall Chart+ in the PI Vision symbol gallery.
- Drag the prepared data sources onto the display in sequence.
- Right-click the symbol and select Configure Waterfall Chart.
- Mark starting, ending, and intermediate absolute values as totals.
- Confirm that each relative bar increases or decreases the running total as expected.
Use the symbol
Read the chart from left to right. Total bars show absolute values, while relative bars show the increase or decrease applied to the preceding running total. Use data labels and tooltips to read exact values.
Configure the symbol
Titles and appearance
- Title: Shows or hides the chart title.
- Sub title: Sets the secondary line below the title.
- Foreground: Sets the chart text color.
- Background: Sets the chart background color.
- Border width and color: Sets the chart outline.
- Shadow: Adds or removes a drop shadow.
Bars and coloring
- Width: Sets the width of the bars.
- Opacity: Sets bar transparency.
- Border radius: Controls corner rounding.
- Default coloring: Uses shared colors for positive, negative, and total bars.
- Custom coloring: Uses the color configured for each data source.
Grid
The Grid section controls what is drawn behind the data: the grid lines, the shaded bands, and the border of the plot area.
- Show: Turns the grid on or off. When it is off, no grid lines or bands are drawn; the Border setting still applies.
- Lines: Selects which grid lines are drawn: None, Horizontal, Vertical, or Both. The names always describe the direction the lines run on screen, whichever orientation the chart uses.
- Bands: Draws alternating shaded bands across the plot area.
- Border: Bounds the plot area. Axes draws the two axis lines with their ticks, Frame draws a rectangle around the plot instead of the axis lines, and None draws neither. Grid lines drawn with Border set to None are dashed.
Grid line color and opacity are not settings; they follow the chart's foreground color and theme.
Data labels
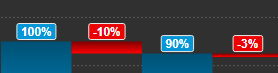
- Enabled: Shows or hides labels on the bars.
- Position: Places labels at the top, center, or bottom of each bar.
- Background: Adds a fill behind labels for contrast.
Total and relative bars
- Total: Displays the complete absolute value. Use totals for the starting value, final result, or an intermediate checkpoint.
- Relative: Applies the value as an increase or decrease to the preceding running total.
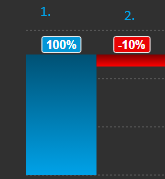
Enable Total for a data source that should display an absolute value.

Data preparation
The symbol displays configured values as provided. Prepare separate attributes for totals and relative contributions before mapping them to the chart.
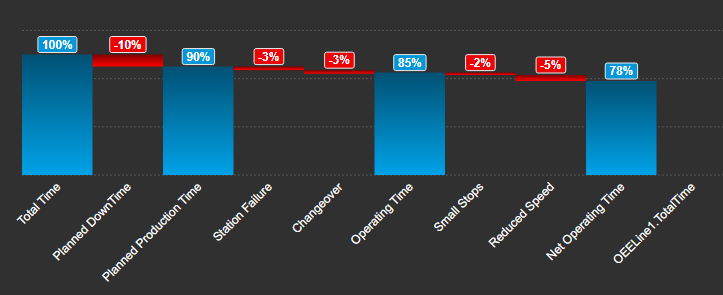
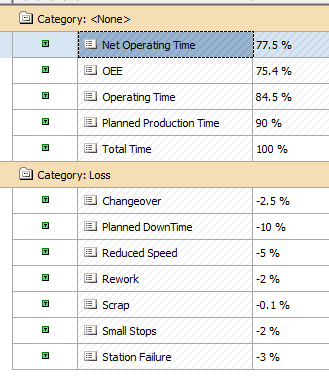
Relative loss values are normally calculated by AF analyses or another upstream calculation. Total attributes can represent checkpoints after each loss or gain.

Troubleshooting and limitations
- The running total is incorrect: Confirm the data-source order and whether each source is configured as a total or relative bar.
- A loss increases the total: Confirm that the relative value is negative or enable the appropriate inversion setting when available.
- A bar starts at zero unexpectedly: Verify that Total is enabled only for absolute checkpoints.
- Expected differences are missing: Calculate the relative values upstream; Waterfall Chart+ does not derive differences between data sources.



