



Asset State Timeline+
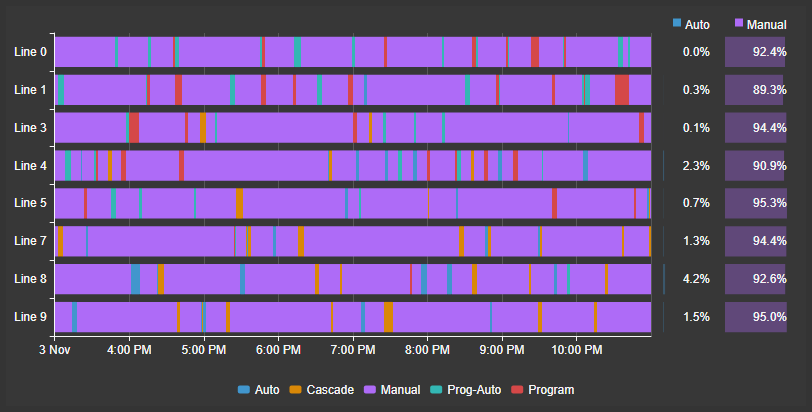
Asset State Timeline+ draws one row per asset with continuous bars colored by digital state, so readers see at a glance what every asset was doing and when. Beside the bars, it can show how much of the time each asset spent in a state.
Overview
When to use it
Use this symbol when you need to:
- See the operating mode, machine state or batch phase of many assets on one time scale.
- Compare how much of the time each asset spent in a state, such as Manual.
- Follow an asset search as it changes, or narrow the assets with a filter symbol.
- Click an asset to show it on the rest of the display, or to open a detail display for it.
- Line up state changes with a trend of the same period.
Choose Asset Time Series Chart+ to trend numeric values across assets. Choose Gantt Chart+ when the bars come from event frames.
Before you begin
- Prepare AF assets that have the same attribute, usually from one element template. The attribute needs digital, enumeration or Boolean history.
- Configure PI Web API for Vision Library+. The symbol loads recorded history, so the account must be able to read the attributes.
- Keep the symbol within 100 rows, one for each asset and attribute.
Add and set up the symbol
- Select Asset State Timeline+ in the PI Vision symbol gallery.
- Drag the Mode attribute of an assembly line onto the display. The symbol shows one row.
- Right-click the symbol and select Add Dynamic Search Criteria....
- Expand Asset Name, enter
Line ?and select Refresh. The?stands for one character.
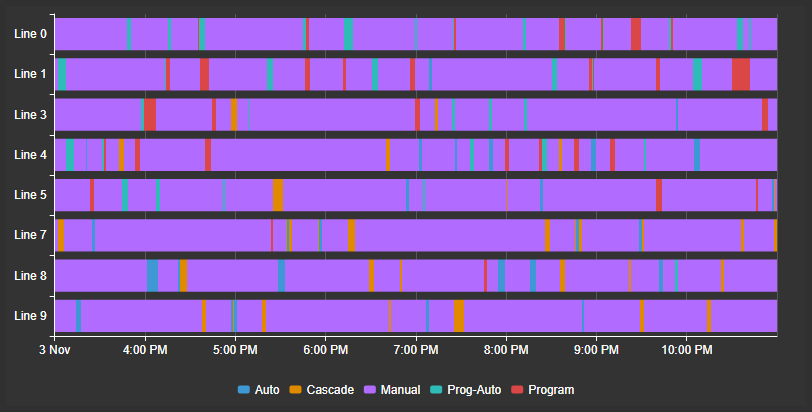
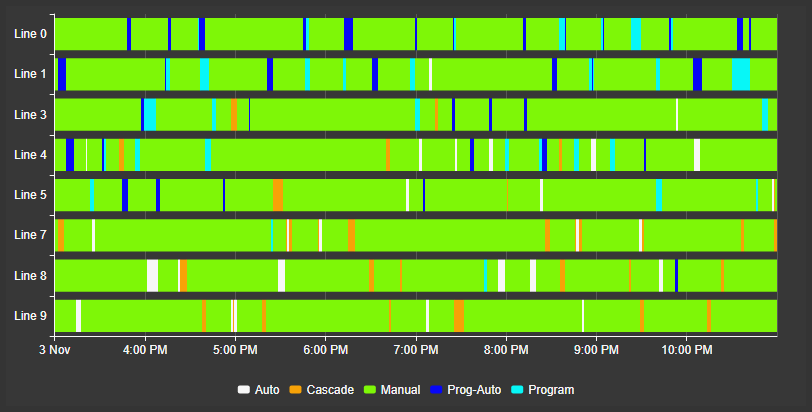
The symbol shows one row for each assembly line, in the display time range. The legend names the states that the rows show.
Common tasks
Show the time in each state
Use this when readers need a number as well as the bars, such as how long each line ran in Manual.
- Right-click the symbol and select Configure Asset State Timeline+....
- Under Attributes, expand % of Time in State.
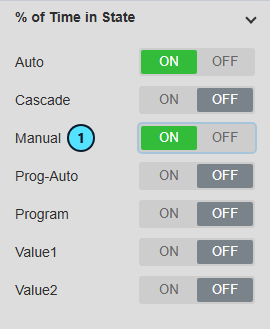
- Turn on each state you want to show, here Auto and Manual (1).
Each state gets a column. A figure is the share of the time with good data in the visible range, so it follows a zoom. Time without good data does not count against the state.
- Click a column header (1) to sort the rows by it: the first click sorts lowest first, the second highest first, and the third returns to the configured order. The sort lasts for your session.
- Hover a figure (2) to read the time in the state, the time with good data, and any gap.
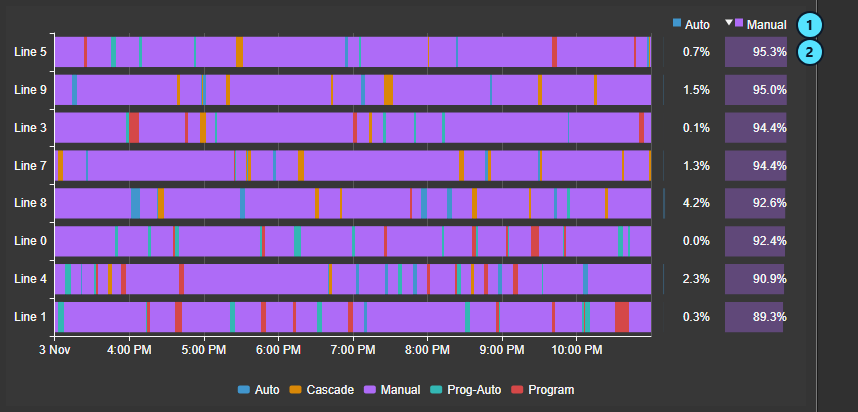
The columns take at most about 40 percent of the width. A column that does not fit is left out, starting from the end of the state names in alphabetical order.
Choose which assets to show
Use this when the symbol shows too many assets, or the wrong ones.
- Right-click the symbol and select Search Criteria....
- Expand Asset Name (1) and enter a name.
*stands for any characters and?for one character. - Expand Number of Results (2) and enter the most assets you want.
- Select Refresh (3).
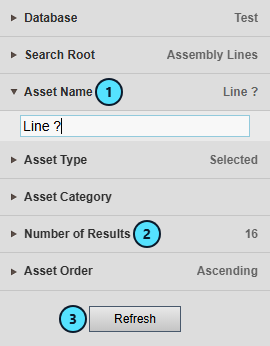
The symbol shows the matching assets. Search Root, Asset Type and Asset Category narrow the search further, and Asset Order sorts the results.
Set the state colors
Use this when each state must have a color your readers already know. Without this step, the symbol gives each state name a color of its own.
- Right-click the symbol and select Add Multi-State....
- Select the attribute and select Enable Multi-State (1).
- Set the color of each state in the States list (2).
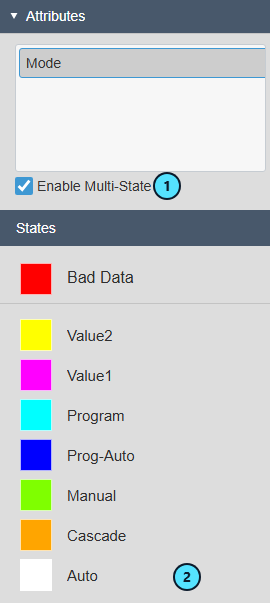
The bars, the legend and the column headers take the colors. A state name has one color on every row. When assets number their states differently, the first row that has the state decides the color. A state you hide in the States list leaves a gap in the bars.
Narrow the symbol with a filter
Use this when operators choose assets by a value, such as the operating mode.
- Place an Asset Filter+ on the display and list the Mode attribute.
- Click a value in the filter, here Manual (1).
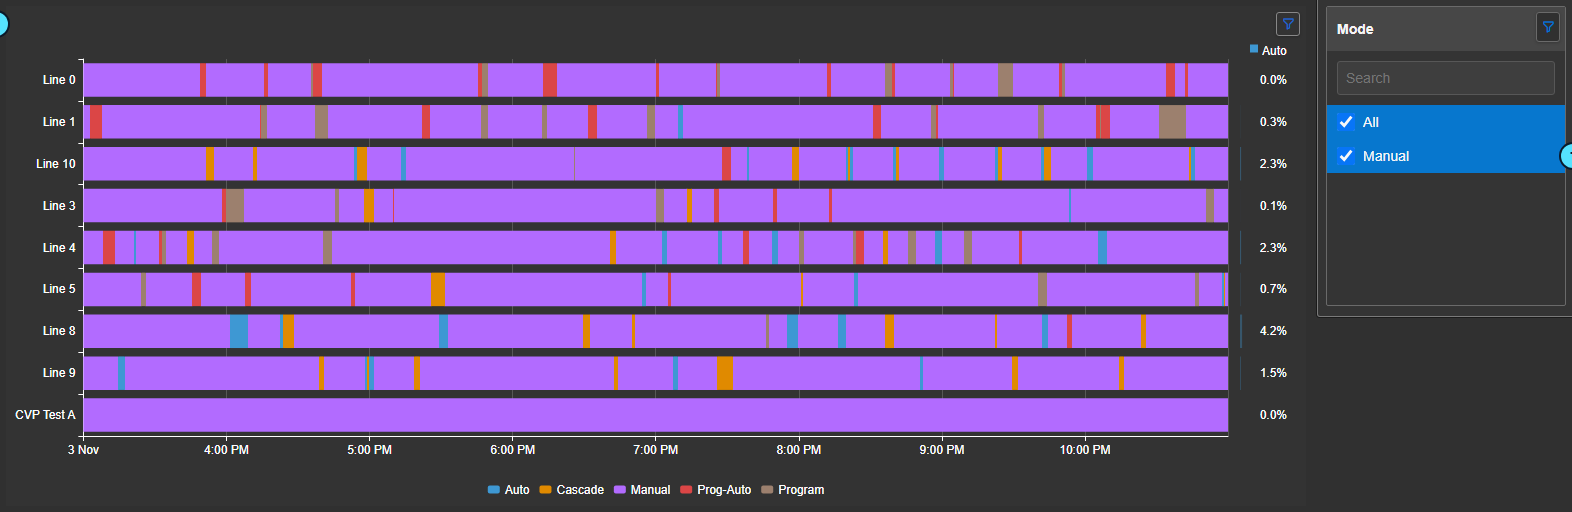
The symbol keeps the assets whose current value matches and shows the filter indicator (2). The filter can only narrow the assets that the search finds. To ignore the filter, open Filtering and turn Ignore Master on.
Open an asset with a click
Use this when clicking a row must show that asset on the rest of the display, or open a detail display for it.
- Right-click the symbol and select Add Navigation Link....
- Select Change context of current display (1) and keep Use current asset (2). To open another display, select Open hyperlink to another page instead and search for the display.
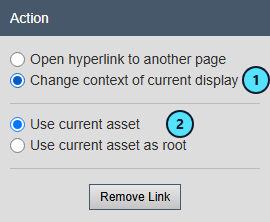
- Close the pane and click a row, its label or its figures.
The display changes to that asset, and Asset (1) shows it. This symbol keeps its rows, so readers can choose the next one. A click on a toolbar button, a column header or the legend, and the end of a pan, do not follow the link.
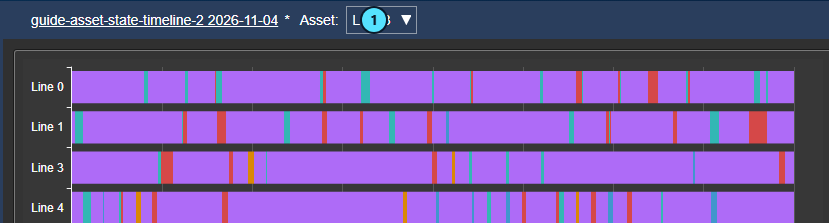
Compare a period with a trend
Use this to look at the same period in the states and in the values, such as what a line's speed did while it ran in Auto.
- Place a time-series chart, such as Asset Time Series Chart+, on the same display.
- Click the plot to place ruler A (1), and click again for ruler B (2). When the symbol has a navigation link, hold Ctrl while you click.
- Drag a handle to move a ruler.
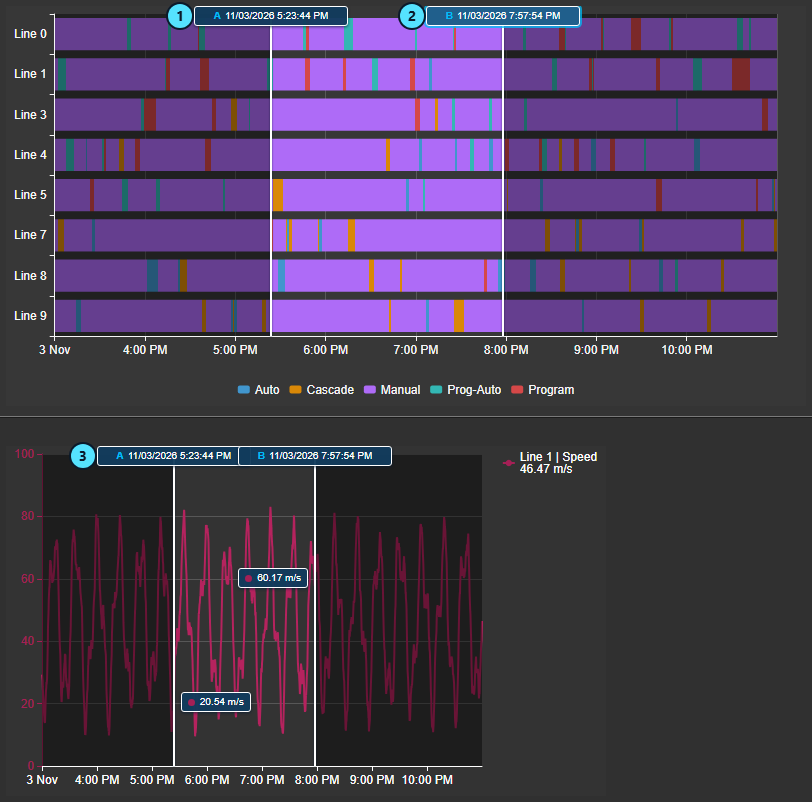
The other chart shows the same rulers (3), and the plot outside them is shaded. Rulers placed on the other chart appear here too. To clear them, select Clear rulers on the toolbar.
Use the symbol
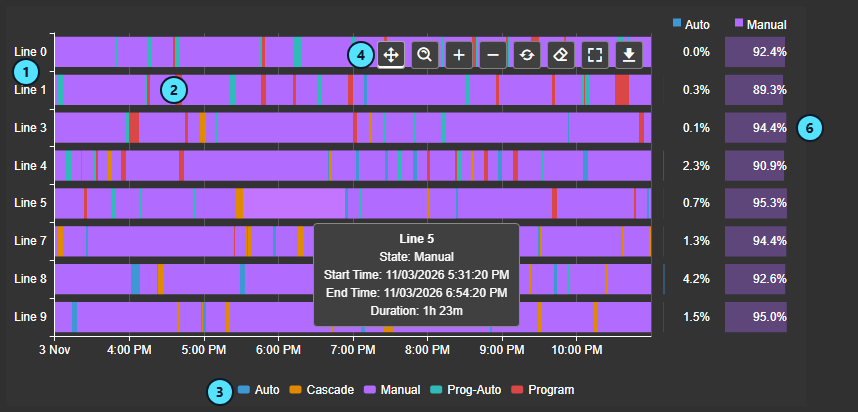
| What it shows | |
|---|---|
| (1) | The row label: the asset, and the attribute when the symbol has several. |
| (2) | The state bars. Where a row has no good data, it has a gap. |
| (3) | The legend with the states in this range. Click an entry to hide or show that state for your session. |
| (4) | The toolbar. Hover a button to see its name. |
| (5) | The tooltip with the state, its start and end, and its duration. |
| (6) | The share of time in the state. |
Interactions
- Hover a bar to read its state and times. Where several short states share one pixel, the bar shows the shortest of them and the tooltip lists them all with their durations. Hover a figure to read its times.
- Hover the plot to show a vertical line at the same time on the other time-series charts of the display. A line appears here when you hover one of them.
- Click the plot to place ruler A, then ruler B. Drag a handle to move a ruler, drag it off the plot or press Delete to remove it, or select Clear rulers. With a navigation link, a click follows the link and Ctrl+click places a ruler. Rulers are not saved.
- Double-click a row to open a popup trend of its attribute.
- Zoom with the mouse wheel, or with Zoom In, Zoom Out and Reset Zoom. Select Pan to drag the window, or Box zoom to drag across the period you want. The display time range follows when you release, and you can go past the loaded range.
- Fullscreen opens a larger view. Download saves a PNG, SVG or PDF image. An image has the bars and the figures, without the rulers.
- A live range shows a dashed marker at the current time.
Nothing in this symbol writes data to the PI System. Zoom and pan change the time range of the display, and a navigation link can change its asset. The symbol reacts to filter symbols and to a change of the asset context of the display.
Configure the symbol
Right-click the symbol and select Configure Asset State Timeline+... The pane sections appear in this order. Search Criteria..., Add Multi-State... and Add Navigation Link... open from the right-click menu.
Trend Options
| Setting | What it does |
|---|---|
| Title, Grid | Appearance of the chart, as labeled. |
| Style | Theme and Font Size. Font, Foreground and Background are available with the Custom theme. |
| Legend | Show the legend, and set its position, placement, alignment and text. |
| Toolbar | Show Toolbar turns the toolbar on. Reveal is On Hover or Always. Always keeps a band above the plot free for the buttons. |
Scales
| Setting | What it does |
|---|---|
| Time Scale | Show the time axis, its position, title and tick count. |
| Rows | Show the row labels, their position and a title. |
Time Range
Start- and Endtimes is Display time range, Custom time range or Duration and offset. A changed range resets the zoom.
Time Bar
Enabled adds the shared Time Bar below the rows. Lock Time Bar keeps the symbol independent of later display time changes. Duration lists the ranges operators can choose.
Attributes
Current Attributes lists the attributes, and each makes one row per asset. The arrows reorder them. Modify Attribute List adds or removes attributes, and at least one stays. Only attributes with digital, enumeration or Boolean values are offered.
| Setting | What it does |
|---|---|
| % of Time in State | One switch per state. Each state that is on gets a column. See Show the time in each state. |
Filtering
Filter Indicator is Compact, Full or Hidden. Ignore Master ignores Master filters. Linked Inputs map another symbol's output channel to an asset property, and Asset Path is the safest property. See Filtering.
Search Criteria
| Setting | What it does |
|---|---|
| Database, Search Root | The AF database and the element the search starts from. |
| Asset Name, Asset Type, Asset Category | Filter by name with wildcards, by element template and by category. |
| Number of Results, Asset Order | Limit the number of assets and sort them. |
Add Multi-State
| Setting | What it does |
|---|---|
| Enable Multi-State | Turns on state colors for the selected attribute, for all assets. |
| States | One color for each state, and Bad Data. See Set the state colors. |
Add Navigation Link
| Setting | What it does |
|---|---|
| Change context of current display | A click on a row sets the asset of this display. Use current asset or Use current asset as root. |
| Open hyperlink to another page | A click on a row opens the address or display under Hyperlink. Open in new tab, Set start and end time and Set asset context apply to it. |
| Remove Link | Removes the link. |
Troubleshooting and limitations
See Troubleshoot chart data loading for the PI Vision log and what to send to support.
| Symptom | Cause | What to do |
|---|---|---|
| An asset has no row. | The search, a filter or the attribute list excludes it, or the asset lacks the attribute. | Check Search Criteria..., the filter symbols and Current Attributes. |
| A row starts later than the others. | The row reached the limit of 50,000 recorded values, and the symbol keeps the newest. | Shorten the time range or show fewer assets. |
| A row has gaps. | The attribute has no good data there, or a hidden state leaves a gap. | Check the data quality of the source and the States list. |
A figure shows -. | The row has no good data in the visible range. | Widen the range or check the source. |
| A state you turned on has no column. | The columns reached their width limit. | Widen the symbol or turn off another state. |
| A filter changes a state's color. | The Multi-State numbers the state differently on the first remaining row. | Give the assets one enumeration set in AF. |
| A click on a row does nothing. | The symbol has no navigation link. | Add one. See Open an asset with a click. |
Limitation: The symbol reads recorded values only, and it does not show string attributes or PI Points without AF.
Limitation: When assets number their states differently, a bar can differ from the color shown for that row in the States list.


