



Vision Library+ / Tables and monitoring
Alarm Table+
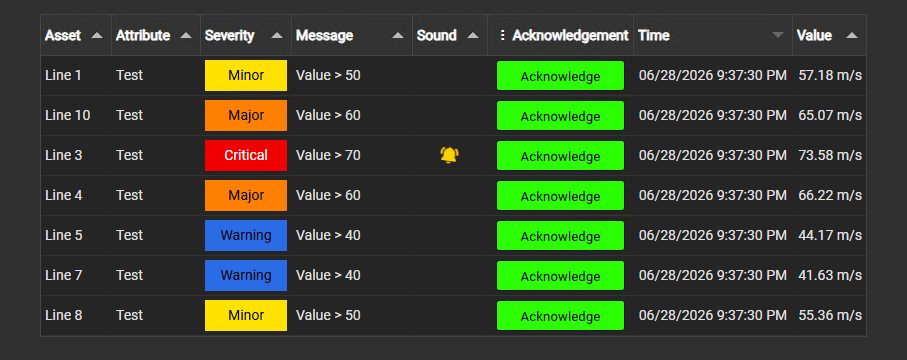
Alarm Table+ collects current alarm conditions in one table and supports acknowledgement, sound, filtering, and contextual actions.
Overview
Alarm Table+ collects current alarm conditions in one table and supports acknowledgement, sound, filtering, and contextual actions.
Watch the demo
See Alarm Table+ in a practical PI Vision workflow.
When to use it
Use this symbol when you need to:
- Monitor alarm conditions across many assets or attributes.
- Give operators one place to review and acknowledge active alarms.
Before you begin
- Prepare the attributes, limits, or Boolean conditions that define each alarm.
- Confirm operator acknowledgement permissions and any required audit settings.
Add and set up the symbol
- Select the symbol in the PI Vision symbol gallery.
- Add the required data sources or asset context to the display.
- Right-click the symbol and open its configuration pane.
- Configure the minimum data, range, and display settings for a useful result.
- Confirm that the symbol shows the expected data.
Basic setup
- Create Alarm Table+ by dragging an attribute onto the display
- Add more Assets or right-click the symbol for “Dynamic-Search Criteria”, to automatically populate the table with the searched assets.
- In Attributes, decide how each attribute should be used:
- Alarm: evaluates conditions and creates alarm rows.
- Data: appears as a supporting data column on alarm rows.
- Limit: provides a dynamic threshold for another alarm condition.
- For each Alarm attribute, define one or more conditions, messages, and severities.
- Choose whether the table should show Current alarms or History.
- Configure acknowledgement, sound, columns, grouping, style, and export options as needed.
Start with a small set of attributes and verify the alarm rows before adding styling or advanced grouping. This makes it easier to confirm that the alarm logic is correct.
Use the symbol
Filter or sort the table to find an alarm, then use the configured acknowledgement action. Acknowledgement changes alarm state and may be recorded for audit purposes.
Acknowledgement
Acknowledgement lets operators mark alarm rows as seen.
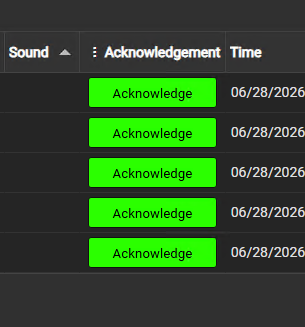
Enable acknowledgement when the display is used for operator response. Disable it when the table is only a passive status list or report.
Required From
Required From controls which severities require acknowledgement.
Choose Critical if only critical alarms should require acknowledgement. Choose Major to require acknowledgement for Critical and Major rows. Choose None if every alarm row should require acknowledgement.
Rows below the threshold show as Not Required instead of an acknowledgement button.
Acknowledgement Text
Use Text to customize the label shown after a row has been acknowledged.
For example, you might use Seen, Checked, or Acknowledged depending on site terminology.
Highlight Rows
Use Highlight Rows when acknowledgement state should be visible without reading the acknowledgement column.
You can choose colors for acknowledged and unacknowledged rows. This is useful on large operator displays where color helps users scan for work that still needs attention.
Blink
Use Blink only for rows that must demand attention.
Blinking rows can be useful on a live alarm board, but they can also become distracting. Keep it limited to high-priority displays or pair it with a severity threshold so lower-priority rows stay calm.
Acknowledge One Row
Click the acknowledgement button in a row to acknowledge that alarm occurrence.
Acknowledge All
Use the acknowledgement column header menu to acknowledge all currently active visible rows. This is useful after filtering to a specific asset, severity, or operating area.
Acknowledgement state is stored locally in the browser for the display and symbol. It is retained for 90 days by default, up to 5000 stored acknowledgements. Clearing browser storage, using another browser, or using another workstation can change what acknowledgement state is visible.
Configure the symbol
Overview and behavior
Alarm Table+ is a PI Vision custom symbol for building operator-facing alarm tables directly from AF attributes and AF calculations. You choose the assets and attributes to monitor, define the conditions that represent an alarm, and the symbol creates alarm rows when those conditions are active.
Use Alarm Table+ when you want one display to answer questions such as:
- Which assets are currently outside their limits?
- Which alarms are most severe?
- Which alarms have been acknowledged?
- When did a historical alarm interval start, end, and how long did it last?
- What supporting process values were present when the alarm occurred?
Alarm Table+ is display-side alarming. It evaluates the values available to the symbol and stores acknowledgement state locally for the display and symbol. It does not create PI Event Frames, write PI Notifications, or write acknowledgement records back to AF or PI Server. For regulated alarm management or server-side notification workflows, use the appropriate PI/AVEVA server-side tools.
How alarm rows are created
Alarm Table+ evaluates each configured Alarm attribute for each asset. If a condition is true, the table creates a row for that asset and attribute.
In Current mode, the table shows only alarms that are active based on the latest values available to the symbol. When a value returns to normal, the row is removed.
In History mode, the table reads recorded values for alarm attributes and creates alarm intervals. A historical row can show start time, end time, duration, start value, and end value. If the alarm is still active at the end of the selected time range, the end time is blank and the row is treated as active.
If more than one condition is true for the same attribute, Alarm Table+ uses the highest severity condition for the row. The severity order is:
- Critical
- Major
- Minor
- Warning
- Information
- None
Attribute source types
Alarm
Use Alarm for attributes that should create alarm rows.
Choose this for process values such as temperature, pressure, level, speed, state, or status where a value outside a limit should appear in the alarm table.
Alarm attributes have conditions. Each condition defines the operator, threshold, optional message, severity, and optional deadband.
Data
Use Data for supporting values that should be shown next to alarm rows but should not create alarms by themselves.
For example, if a pump temperature creates the alarm, you might add pump speed, mode, product, or upstream pressure as Data columns. This helps operators understand the context without opening another display.
In Current mode, Data columns show the current values for the same asset. In History mode, Alarm Table+ fetches contextual data values at the alarm time so the historical row can show what else was happening when the alarm started.
Limit
Use Limit for attributes that hold thresholds used by dynamic alarm conditions.
For example, instead of entering a fixed high temperature limit of 80, you can mark an asset-specific high limit attribute as Limit and compare the temperature to that limit. This is useful when each asset has different engineering limits or when limits are maintained in AF.
Limit attributes do not create alarm rows and do not appear as normal Data columns. They are used as selectable dynamic threshold sources in alarm conditions.
Configuring alarm conditions
Each Alarm attribute can have one or more conditions.
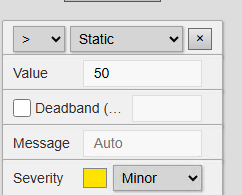
Operator
The operator controls how the attribute value is compared to the target value:
- =: alarm when the value equals the target.
- !=: alarm when the value does not equal the target.
- > / >=: alarm when a numeric value is above the target.
- < / <=: alarm when a numeric value is below the target.
Numeric comparison operators are intended for numeric attributes. For string, digital, and Boolean values, use equality or inequality.
Static Value
Use Static when the same threshold applies everywhere.
Examples:
- Temperature > 80
- Pump State = Failed
- Running = False
Static values are simple and easy to audit. They work well when all assets share the same limit or when the threshold is display-specific.
Dynamic Value
Use Dynamic when the threshold should come from another attribute on the same asset.
Example:
- Temperature > High Temperature Limit
- Pressure < Low Pressure Limit
Dynamic limits are best when limits are maintained in AF or vary by equipment. First set the limit attribute's Source Type to Limit, then select it in the condition's dynamic value dropdown.
If the selected limit value is empty or unavailable for an asset, that condition will not create an alarm for that asset.
Deadband
Deadband is available in Current mode for numeric >, >=, <, and <= conditions.
Use deadband to prevent alarms from repeatedly appearing and disappearing when a value is hovering near the threshold. The value is entered as a percentage of the threshold.
Example:
- Condition: Temperature > 100
- Deadband: 5
- The alarm starts when Temperature is above 100.
- It clears only after Temperature drops below 95.
For low-limit alarms, the clear point moves above the threshold. A condition of Pressure < 100 with a 5 percent deadband clears after Pressure rises above 105.
Use small deadbands for stable values and larger deadbands for noisy signals. Do not use deadband to hide a bad limit; fix the limit first.
Message
Use Message to write the alarm text operators should see.
Good messages describe the condition in operator language:
- High discharge pressure
- Pump is not running
- Temperature above asset high limit
If Message is blank, Alarm Table+ generates a message from the condition, such as Value > 80 or Value > High Limit (80).
Severity
Use Severity to communicate priority. Severity also drives acknowledgement thresholds, sound thresholds, summary counts, grouping, sorting, and severity colors.
Use Critical and Major for alarms that require immediate operator response. Use Minor, Warning, or Information for conditions that should be visible but are less urgent. Use None only when the row should not carry a meaningful alarm priority.
Data retrieval
Current Mode
Use Current mode for live monitoring displays.
Current mode is the right choice for control room screens and overview displays where operators need to see what is active now. It creates one row per active alarm occurrence and removes rows as values return to normal.
Current mode supports AF attributes and supported AF calculations.
History Mode
Use History mode for review and analysis.
History mode reads recorded values over the symbol's time range and builds alarm intervals. It is useful for answering questions such as:
- When did the alarm start?
- Has it cleared?
- How long did it last?
- What was the start value and end value?
History mode is intended for recorded AF attribute values. AF calculations can be used in Current mode, but historical replay depends on recorded AF attribute data that the PI Web API can retrieve.
Max Rows
Use Max Rows to control how many historical alarm intervals are shown.
Increase it when investigating a busy time range. Decrease it when the table is used on an overview display and should remain responsive.
Descending
Use Descending when the newest historical alarm intervals should appear first.
Turn it off when you want to read the alarm sequence from oldest to newest.
Sound
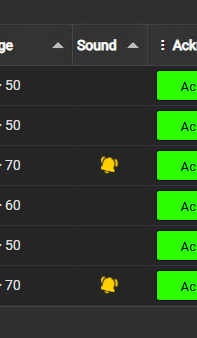
Sound plays an audible alert when there is an unacknowledged alarm that meets the configured severity threshold.
Enable sound only on displays where an audible alarm is appropriate. It is usually best for dedicated operator displays, not for analysis displays or screens that many users open casually.
Source
Choose the alarm sound file from the predefined list
Choose a sound that matches the urgency of the display. A high-intensity sound should be reserved for high-priority operator response.
Play From
Play From controls the minimum severity that can trigger sound.
Choose Critical for only the highest-priority alarms. Choose Major to include Critical and Major. Choose None if any unacknowledged alarm row should play sound.
In History mode, sound only plays for rows whose alarm interval is still active.
Acknowledging the row stops sound for that alarm occurrence when no other unacknowledged sound-eligible alarms remain.
General table options
Layout
Layout controls how columns use horizontal space.
- Fit Data: columns size to their contents. Use this when values and messages need room, even if users must scroll.
- Fit Width: columns fit into the available symbol width. Use this for dashboard screens where the whole table should remain visible.
- Manual: use saved column widths and allow column resizing. Use this for tuned operator displays where column sizes should stay predictable.
Right to Left
Use Right to Left for right-to-left languages and layouts.
Summary Bar
Use Summary Bar to show compact counts above the table.
The summary includes total alarms, counts by severity, and acknowledgement counts. It follows the table's active filtered rows, so filtering the table also changes the summary.
Columns
Use the Columns list to show, hide, rename, and reorder table columns.
Common columns include:
- Asset
- Description
- Attribute
- Severity
- Message
- Sound
- Acknowledgement
- Time and Value in Current mode
- Start Time, End Time, Duration, Start Value, and End Value in History mode
- Additional Data columns for attributes marked as Data
Hide columns that do not help the user act. Rename columns when site terminology is clearer than the default label.
Header
Use Show to hide the table header on compact dashboard tiles.
Use Alignment to align header text with the table style.
Use Filter when users need to narrow alarms by asset, severity, acknowledgement state, message, time, or value. Filters are most useful on larger tables and historical review displays.
Grouping
Grouping organizes rows into collapsible sections.
Useful grouping examples:
- Group by Severity on an operator alarm board.
- Group by Asset when many attributes can alarm per asset.
- Group by Acknowledgement to separate unacknowledged rows from acknowledged rows.
- Group by Start Time using Hour or Day buckets for historical review.
Use Auto Expand when users should immediately see rows inside each group. Turn it off when groups are used as a high-level index.
Numbers
Use Numbers to control numeric formatting.
Set number formatting when operators need consistent precision, units, or thousand separators. This is especially useful when the same table mixes values with very different scales.
Multi-state styling
Alarm Table+ supports multi-state styling per attribute through the PI Vision multi-state configuration flow.
Use multi-state when the value itself should be visually encoded in addition to the alarm severity. For example, a supporting Data column can use multi-state color to show whether a related process value is normal, warning, or abnormal.
Available multi-state display properties include:
- Fill
- Badge
- Text
- Progress
- Progress and Value
Use Apply to Row when the selected attribute should color the whole row. This can be effective when one value defines the state of the asset. Do not overuse row-level multi-state on dense tables, because it can compete with severity and acknowledgement colors.
Progress styles are intended for cell-level display and do not support applying to the whole row.
Practical configuration patterns
Live Operator Alarm Board
Use Current mode, enable acknowledgement, enable sound for Critical or Major alarms, show the summary bar, and group by Severity or Asset. Keep only the columns needed for action: Asset, Attribute, Severity, Message, Time, Value, Sound, and Acknowledgement.
Per-Asset Dynamic Limits
Mark the measured value as Alarm and the AF limit attribute as Limit. In the condition, choose Dynamic and select the limit. Use this when each asset has its own limit or when limits are maintained centrally in AF.
Alarm With Context
Mark the trigger attribute as Alarm and related process values as Data. This creates one alarm row with enough surrounding information for operators to understand the situation quickly.
Historical Alarm Review
Use History mode, increase Max Rows if needed, show Start Time, End Time, Duration, Start Value, and End Value, and group by time bucket, asset, or severity. Export to XLSX or PDF after filtering to the area or time period being reviewed.
Quiet Status Table
Use Current mode, disable acknowledgement and sound, keep severity and message visible, and use a light or transparent style. This is useful when the table is meant to summarize abnormal conditions without becoming an operator alarm board.
Troubleshooting and limitations
- Check: If an expected row is missing, check its alarm condition, retrieval mode, and active time range.
- Check: Acknowledgement and sound behavior depend on the configured permissions and browser session.
Behavior to know
- Alarm Table+ only shows rows for attributes marked as Alarm.
- Data attributes add context columns but do not create alarm rows.
- Limit attributes provide dynamic thresholds but do not create rows or visible columns.
- If multiple conditions match, the row uses the highest severity matching condition.
- Dynamic limits must resolve to a value for the same asset, otherwise the condition does not fire.
- Deadband applies to Current mode numeric threshold conditions.
- History mode builds intervals from recorded AF attribute values.
- Sound plays only for unacknowledged sound-eligible alarms. In History mode, only active historical intervals can play sound.
- Acknowledgements are local display/browser state, not PI Server or AF writes.
- Hiding a column does not disable the underlying alarm logic. To stop an attribute from creating rows, change its Source Type or remove the attribute from the current attribute list.



