



Vision Library+ / Gauges and process visualization
Asset Treemap+
Asset Treemap+ displays a hierarchy of assets as nested boxes whose size and color represent configured values.
Overview
Asset Treemap+ displays a hierarchy of assets as nested boxes whose size and color represent configured values.
Watch the demo
See Asset Treemap+ in a practical PI Vision workflow.
When to use it
Use this symbol when you need to:
- Compare asset magnitude and status in the same view.
- Navigate a large AF hierarchy from parent groups to individual assets.
Before you begin
- Prepare a consistent AF hierarchy and numeric attribute for box size.
- Choose a status or numeric attribute for color when color encoding is required.
Add and set up the symbol
- Select the symbol in the PI Vision symbol gallery.
- Add the required data sources or asset context to the display.
- Right-click the symbol and open its configuration pane.
- Configure the minimum data, range, and display settings for a useful result.
- Confirm that the symbol shows the expected data.
Use the symbol
Select a group to drill into it, then use the breadcrumb to return to a higher level.
The chart toolbar appears at the top right when the pointer or the keyboard focus enters the chart, and hides shortly after it leaves. Set Appearance > Toolbar > Reveal to Always to keep it in view; the chart then keeps a band of its plot area free so the buttons never cover the tiles. On a touch device the toolbar is always shown. The toolbar carries Fullscreen and Download. A treemap does not zoom, so it has no zoom or drag-mode buttons; drilling into a group is still a click on the tile, and the breadcrumb is still how you come back up.
Fullscreen opens the current treemap in a large dialog without requesting data again. It opens at the level you were drilled into and keeps the color scale you were looking at, and it carries the same toolbar without the Fullscreen button.
Use Download to open the export menu: PNG, SVG and PDF chart views, or CSV, JSON and XLSX data. Files are named <symbol name>-<yyyyMMdd-HHmmss> with the format's extension, using your local clock. A data export writes one row per tile currently drawn - groups as well as assets - carrying Asset (the tile caption), Parent, Attribute (the one that sets the box size), Value, Units, and Level. Parent is what tells two assets of the same name apart. When the administrator disables data exports, the menu keeps the image formats and drops CSV, JSON and XLSX.
Grouping strategy

Control how assets are organized visually using the Grouping settings.
- Mode: Path (Hierarchy)
- The default mode. The symbol automatically parses the AF Element Path of each asset (for example, Site \ Area \ Line).
- Common root folders are detected, and assets are nested accordingly.
- Include Root - toggle this to show or hide the top-level folder as a group.
- Mode: Attributes
- Group assets by their metadata values (for example, Manufacturer, Location, or Asset Type).
- Add multiple attributes to create nested groups - for example, first by Location, then by Manufacturer within each location.
- Mode: None
- Displays all assets as a flat list with no nesting. Useful for simple side-by-side comparisons.
Interactive drilldown
When enabled, drilldown lets users navigate through the asset hierarchy.
- Enable Drilldown - toggle this option in the Grouping section.
- Behavior - clicking a group header zooms into that group, hiding the rest of the chart. A breadcrumb navigation bar appears at the top so users can navigate back up the hierarchy.
- Note: Drilldown is not available when Grouping Mode is set to None.
Configure the symbol
Overview and behavior
Asset Treemap+ displays hierarchical asset data as a set of nested rectangles. Each branch of the hierarchy is represented by a colored rectangle containing smaller rectangles (leaves) for individual assets.
The symbol helps operators and engineers visualize large asset sets at a glance. It lets you:
- Compare Magnitudes - quickly spot outliers (for example, assets with high energy consumption) based on box size.
- Monitor Status - immediately identify issues such as high temperatures or error states based on box color.
- Analyze Hierarchy - drill down from plant level to line level to individual assets.
Configure box size
Box size represents a numerical value (Area). Assets with a larger value appear as larger boxes; assets with a value of 0 or no data are hidden or minimized.
- Value Source - in the Data section, select the attribute that represents the magnitude (for example, Power, Flow Rate, or Capacity).
- Behavior - assets with a larger attribute value appear as larger boxes. Assets with a value of 0 or no data are hidden or minimized.
Coloring rules
Box color is highly configurable. Select one of the following Coloring Modes:
A. Auto (Palette)
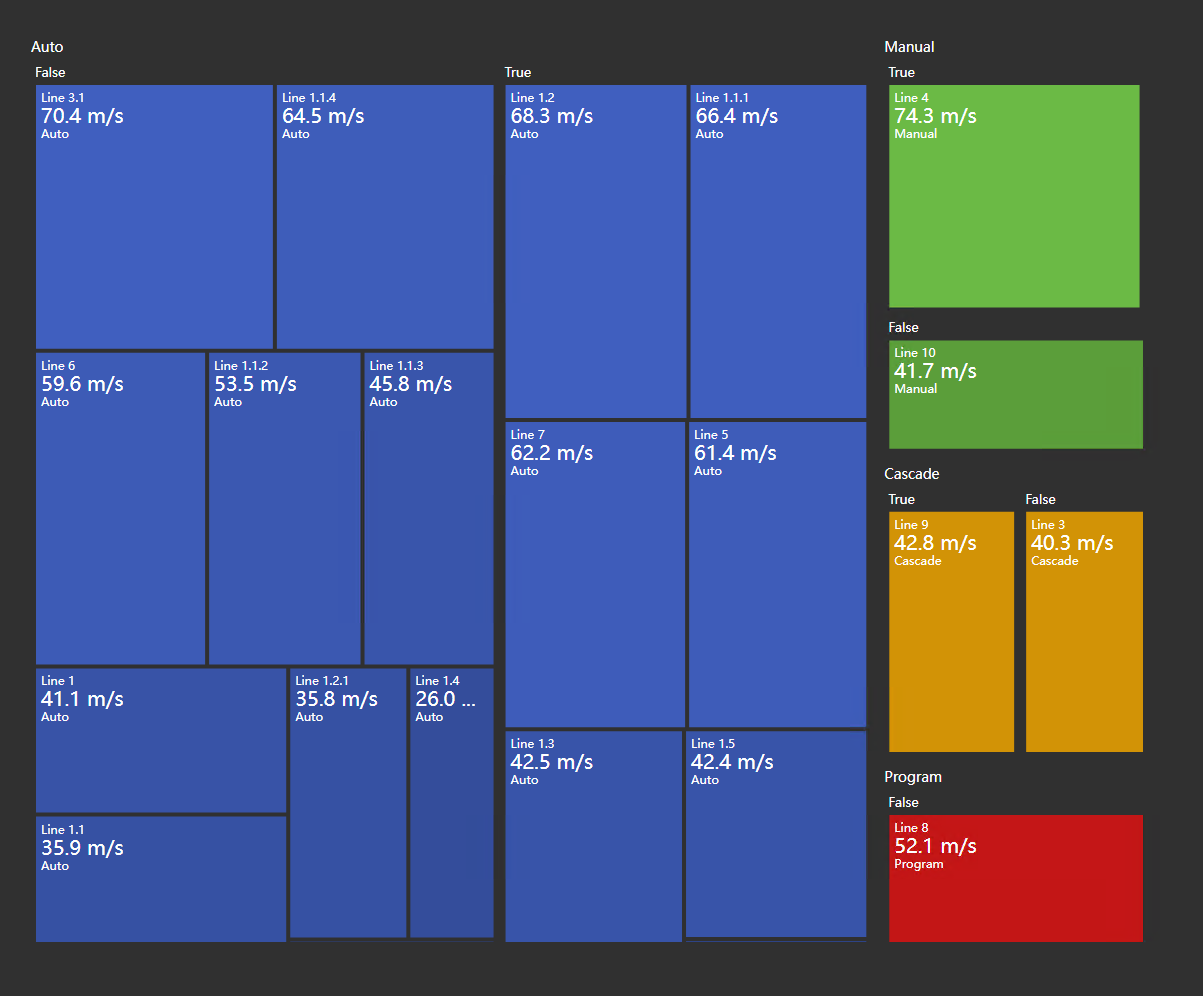
The symbol assigns distinct colors from a predefined palette to each leaf node. Use this mode to distinguish between assets without defining specific conditions.
B. Custom (Manual Mapping)
Map specific attribute values to specific colors. For example, if you group by a Status attribute, you can assign Running = Green and Stopped = Red.
- How it works - if you group by an attribute (for example, Status), you can define that Running = Green and Stopped = Red.
- Configuration - detected values appear in the configuration pane. Click the color swatch next to a value to change it.
C. Value (Heatmap)
Colors boxes based on a numerical value such as Temperature or Efficiency. Select the attribute to use for coloring.
- multi-state Support - if the selected attribute has a multi-state definition in PI AF, the symbol uses those states and colors automatically. This is the recommended approach for visualizing alarm states.
- Gradient (Range) - if no multi-state definition exists, the symbol applies a color gradient.
- Range Type - choose Auto to calculate Min/Max dynamically from the current data, or Custom to define fixed limits.
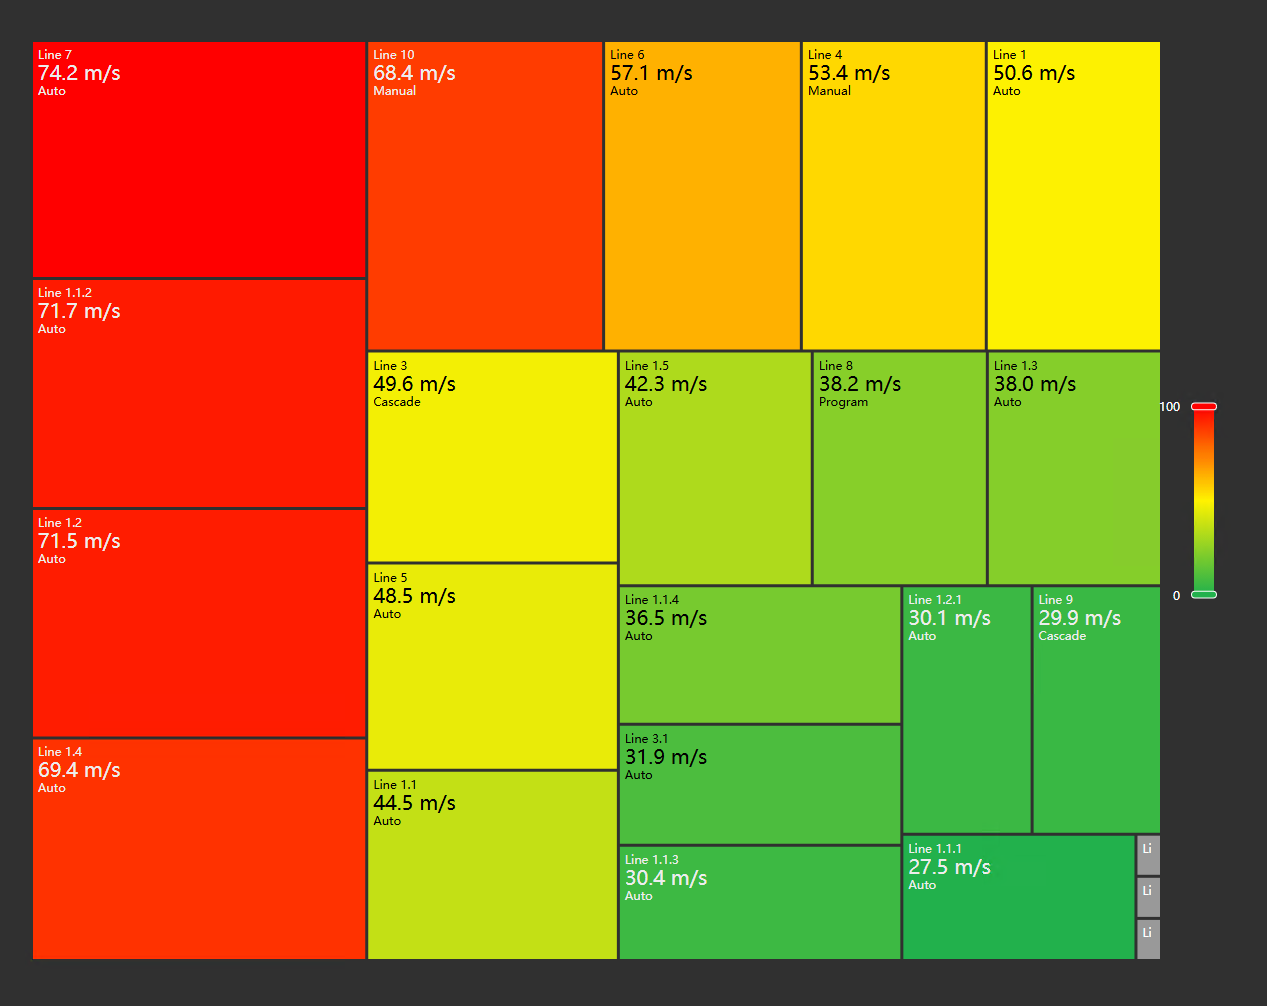
- Gradient - color shifts from green (low) through yellow (medium) to red (high) based on the current value.
- Legend - a color scale bar appears to the right of the chart. Toggle it on or off as needed.
Data labels
Customize the text displayed inside each asset box.
- Show - toggle labels on or off.
- Position - choose where text aligns within the box (for example, Center or Top Left).
- Attributes - display multiple lines of text per box (for example, the asset name on the first line and the temperature value on the second).
- Font Size - each attribute line has its own font size, so you can make the asset name small and the value large.
- Show Units - automatically appends the unit of measure defined in PI AF to each displayed value.
Appearance & style
- Title - add a custom title at the top of the chart.
- Colors - set the Background Color (chart area) and Foreground Color (text).
- Base Font Size - sets the global text scale. Group headers automatically scale up relative to this value to visually distinguish hierarchy levels.
- Toolbar - controls the chart toolbar. Show turns it on or off, and Reveal chooses between showing the toolbar on hover and showing it always. Always also reserves a band of the chart area for the toolbar, minus whatever the title already occupies; with Show off nothing is drawn and no chart area is reserved. Newly placed symbols start with the toolbar on; symbols saved before this release keep it off until you turn it on.
Screenshots in this article predate the chart toolbar.
Filtering
Asset Treemap+ receives asset Master filters and Linked inputs. Set Interactivity > Selection > Click Action to FILTER to publish the clicked asset through configured Linked outputs. None, Quick Trend, Drilldown, and Filter are mutually exclusive actions.
The shared indicator shows the effective asset count and clears a selection owned by the treemap. See Filtering dashboards for the complete channel model.
Troubleshooting and limitations
- Check: If a box is missing, check the hierarchy search and the value used for box size.
- Check: Zero or missing size values can make assets too small to display.



