



Custom SQL Visualization+
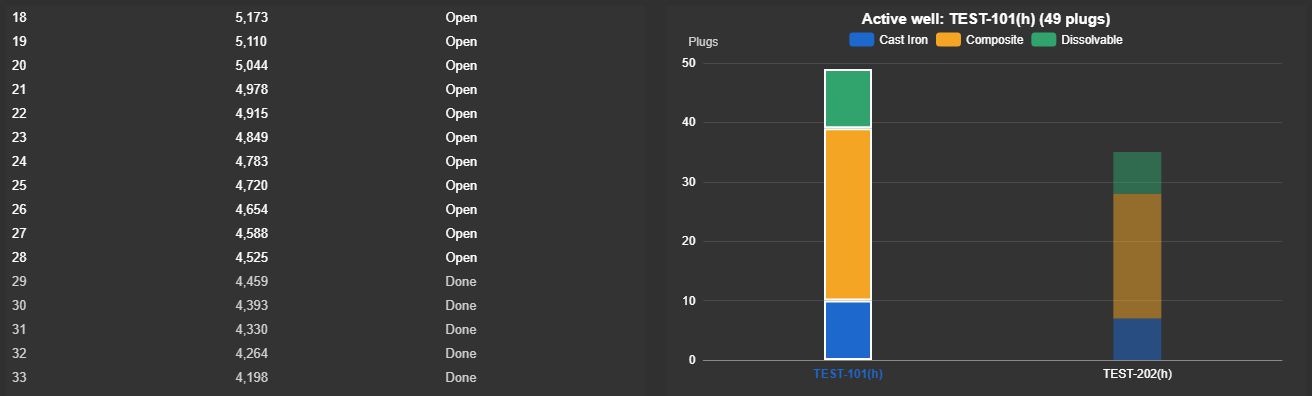
Custom SQL Visualization+ shows a visualization that you let an AI write as one HTML document, fed with the live values of the symbol's data sources and the rows of AF tables. A live position against a list of planned points, or a status board built from several tables, becomes display content without a dedicated symbol.
Overview
When to use it
Use this symbol when you need to:
- Track a live position against a table of planned points, such as a depth track.
- Join several AF tables in one view and combine them with live values.
- Show a plan or limit list that people maintain in AF, without changing the display when the list changes.
- Have an AI write the visualization from a description, without programming skills.
Choose Custom Visualization+ when the document needs no tables. Choose SQL Table+ when a plain table of the rows is enough: it needs no code.
Before you begin
- The administrator has installed the
framesfolder and can limit code editing and writes. See "Install the Vision Library+ Files" and "Configure Custom Visualization+" in the installation and administration guide. - The AF table exists, linked or static.
- The symbol has at least one data source: tables reload on PI Vision's data updates.
- You have access to an AI that your company allows. The prompt you paste there holds table names, column names and the current values of the data sources.
Add and set up the symbol
- Select Custom SQL Visualization+ in the PI Vision symbol gallery and drag one or more data sources onto the display. The symbol shows a starting example: the values of the data sources and "Pick an AF table in the configuration pane."
- Right-click the symbol and select Configure Custom SQL Visualization+....
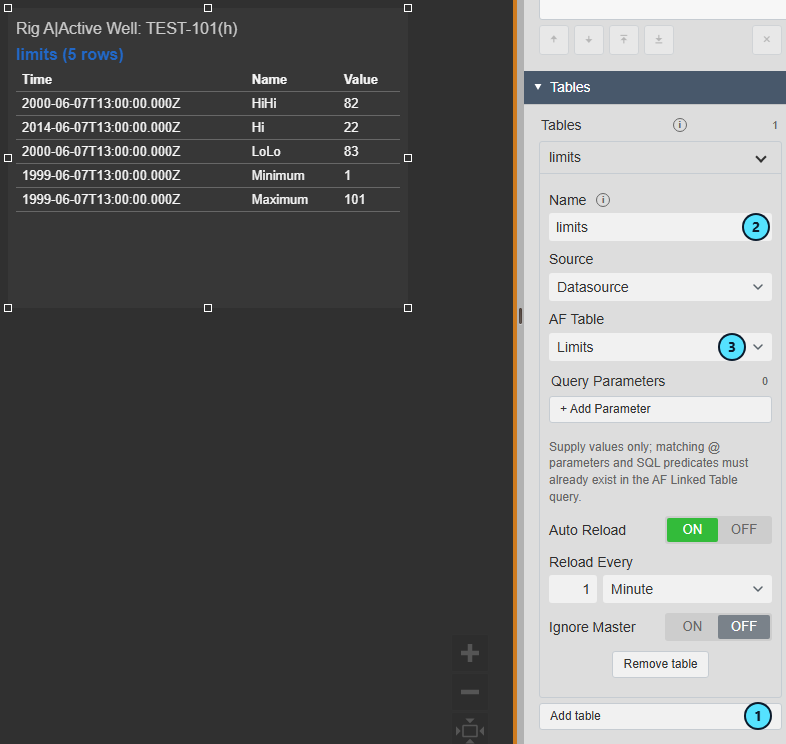
- Under Tables, select Add table (1).
- Enter the Name (2) the document reads the table by, such as
limits. - Select the table under AF Table (3).
- Close the pane and save the display. The starting example now lists the rows of the table.
Next, replace the starting example with your own document, as the first task shows.
Common tasks
Get a document from an AI that uses your tables
Use this when you can describe the view in words and the tables are set up.
- Right-click the symbol, select Configure Custom SQL Visualization+..., and select Edit code.
- To show the AI what the values look like, turn on Include sample rows (1). The next copy sends up to 5 rows of each table to the AI, and the box is off again after that copy.
- Select Copy AI prompt (2).
- Paste the copied text into your AI chat and add your request. Name the tables and columns exactly, for example "From the table
plan, mark each row done once the first source has passed itsDepthcolumn." - Paste the AI's answer into the code area, select Run, and check Output for errors.
- Select Apply, close the pane and save the display.

The prompt lists each table's name, columns and column types as of the last load, so add the table before you copy. Without Include sample rows, the copied prompt holds no row values. For advice on writing the request, see Write a request that gets a good result.
Track a live value against a table of points
Use this for a live position against planned points. The example document does this and is a good start to adapt.
- Drag two data sources onto the symbol in this order: a text value that names the active item, such as the active well, and the live number, such as the depth.
- Add a table named
plugswith the columnsStage,MD(Mt)andWell. - Select Edit code, paste the example document into the code area and select Run.
- Select Apply, close the pane and save the display.
- If your columns have other names, ask for the change with Copy AI prompt (change).
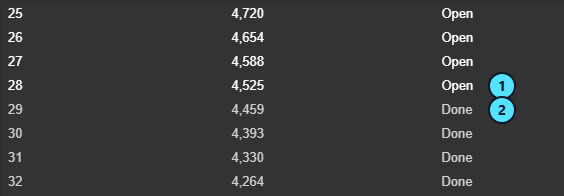
The list shows the rows of the active item. A row stays Open (1) until the live value reaches its point and then reads Done (2).
Combine several tables in one view
Use this when the view needs rows from more than one table, such as points from one table and a status from another. Joining happens in the document.
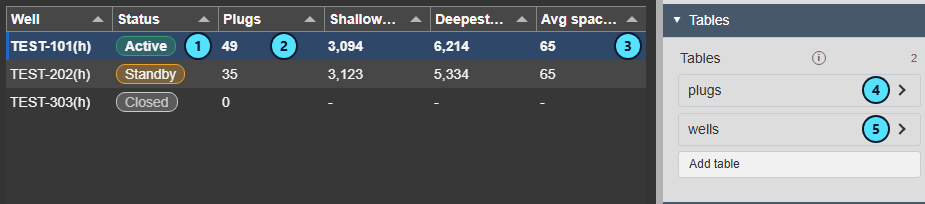
- Under Tables, select Add table for each table, up to 5, and give each a Name (4) (5).
- In your request to the AI, name the tables and the column that connects them, for example "Join
plugsandwellsonWell. Highlight the well in the first source." - Paste the answer, select Run, select Apply, and save the display.
Below, the status (1) comes from wells, the count (2) from plugs, and the highlight (3) from a live data source.
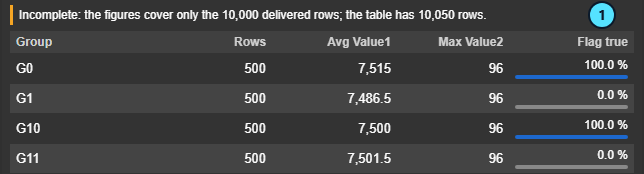
A table delivers at most 10,000 rows, the first ones that match any filter. Above that the document is told the rows were cut off and how many match, so ask the AI to say so (1).
Filter the rows with SQL Filter+
Use this when operators narrow the view by clicking values in a SQL Filter+ on the same AF table.
- Add a SQL Filter+ on the table that the symbol reads.
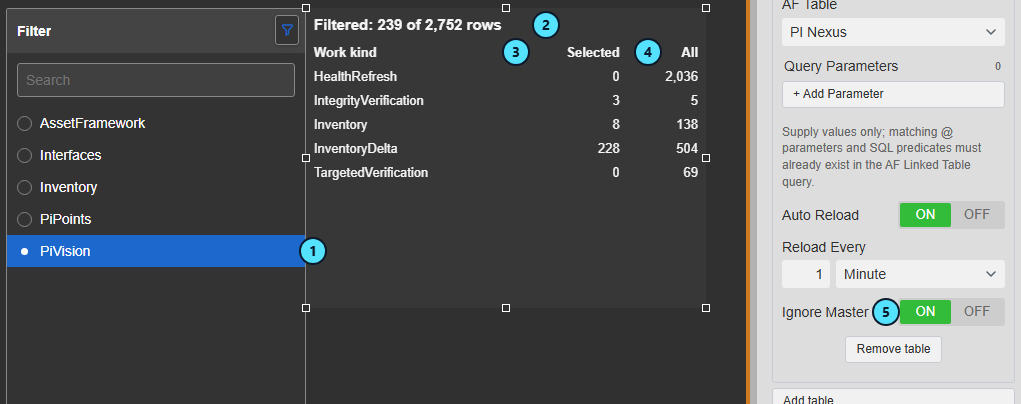
- To show selected against total, add the same table a second time under Tables, named for example
all, and turn Ignore Master on (5) for that entry. - In your request to the AI, ask it to show the filter state, for example "Show
rowCountoftotalCountfromselected, and say so when no rows match." - Paste the answer, select Run, select Apply, and save the display.
- Click a value in SQL Filter+.
Only the matching rows reach the document. After a click on one value (1), the document reports 239 of 2,752 rows (2) and counts the selected rows (3) beside every row of the entry with Ignore Master on (4). With no match, the rows are empty and there is no error.
The symbol has no filter indicator of its own, so the document must show the filter state itself.
Follow the display asset
Use this when one display serves several assets, each with its own version of the table in its AF database.
- Use attributes of the asset as data sources.
- Under Tables, leave Source on Datasource.
- Select the table under AF Table. Each asset's database needs a table of that name.
- Save the display.
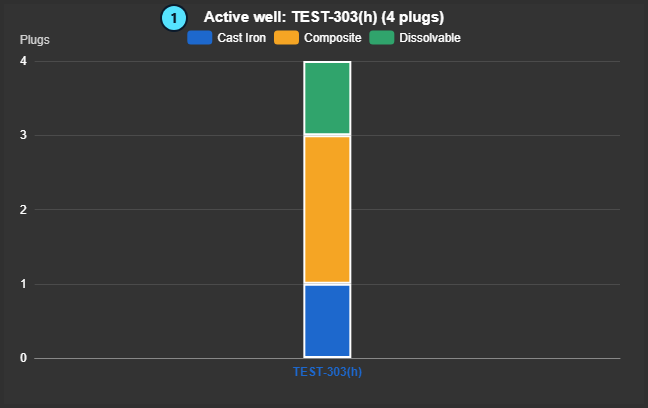
When the asset changes, the values follow and the symbol reads the table of the same name in the new asset's database. The rows of the old table are withdrawn first, so no one reads them as this asset's. Below, the chart shows the other asset's active well (1) and the rows of its table.
Check the values and fix the look with a follow-up
Use this after every answer from an AI, before operators see the result. Expect to ask for a follow-up on the layout: a first answer can have the values right and still crowd the view.
- Right-click the symbol, select Configure Custom SQL Visualization+..., and select Edit code.
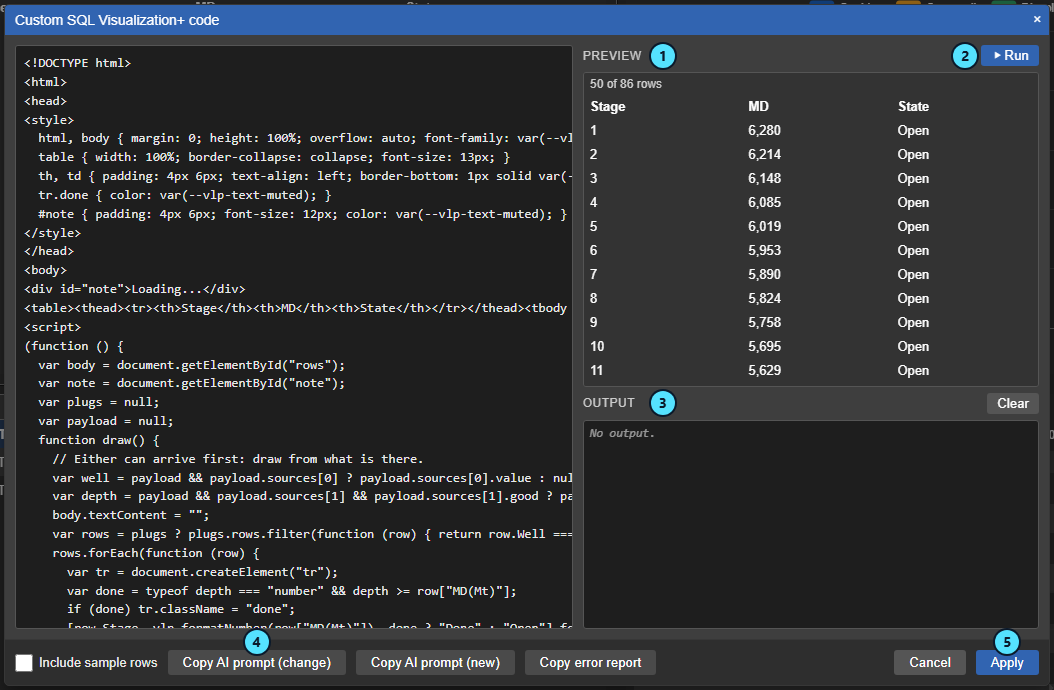
- Select Run (2). The Preview (1) runs the draft on current data and rows, and Output (3) lists errors.
- Compare a few values with the AF table and with a PI Vision trend. Include rows on both sides of a limit.
- Select Copy AI prompt (change) (4), paste it into your AI chat and ask for one change at a time, for example "Keep every value. Make all rows fit at 800 by 500."
- Paste the answer, select Run, and repeat steps 3 and 4 until the view is right.
- Select Apply (5), close the pane and save the display.
Who owns the code: you own a generated document and its correctness on live operations. Software Athlete supports the symbol and its document functions. Compare the values against the AF table and a PI Vision trend before operators rely on it.
Use the symbol
What an operator sees and can do is defined by the document. The chart below is built from the rows of one AF table.
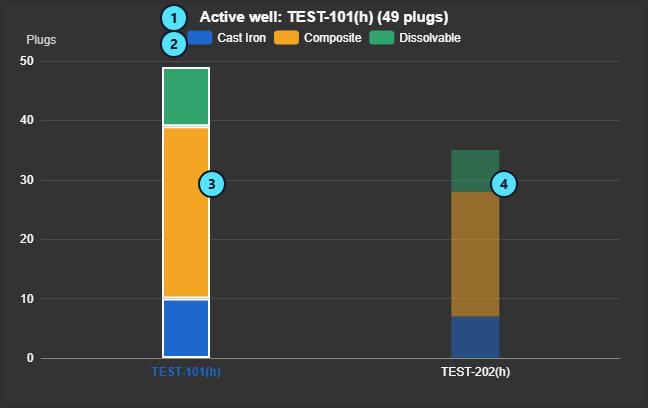
| What it shows | |
|---|---|
| (1) | The active item from a data source and a count from the rows. The name updates with PI Vision's data updates. |
| (2) | Categories that come from a table column. |
| (3) | The bar of the active item, marked by the live value. |
| (4) | The other rows of the table, dimmed by the document. |
- Hover, click and keys do what the document provides. See Use the symbol in the Custom Visualization+ guide.
- Rows update when a reload brings a change, at the Reload Every interval, and when a SQL Filter+ selection changes them.
- Writes: the document cannot change a table. It writes values only to its data sources, when Allow writes is on.
When a table cannot be read
The symbol tells the document; what the operator then sees is up to the document, so ask the AI to show these states.
- A reload fails: the document keeps its last rows and receives the error (1). The symbol retries on its own, less often the longer the failure lasts.
- The first load fails: the document has no rows and receives the error.
- The table does not exist in the asset's database: the document has no rows and receives the "was not found" message from the table below.

Configure the symbol
Right-click the symbol and select Configure Custom SQL Visualization+.... The pane has the groups Datasources, Tables, Code, Parameters, Filtering and Style, followed by the standard Web API, License Status, Help and About groups.
Data sources
The data sources in the order the document reads them. See Data sources in the Custom Visualization+ guide.
Tables
| Setting | What it does |
|---|---|
| Add table | Adds a table with a generated name. Unavailable with 5 tables. |
| Name | The name the document reads the table by, so you can change the table without changing the code. Starts with a letter, up to 40 letters, digits or _, and is unique in the symbol. |
| Source | Datasource looks up the table by name in the AF database of the first data source, so it follows the asset. Custom uses the AF server and database you choose. Shown when the first data source is an AF attribute. |
| AF Server, AF Database | The AF server and database. Available when Source is Custom. |
| AF Table | The table to read. |
| Query Parameters, + Add Parameter | Values for the @ parameters of a linked SQL table, set as in SQL Table+. The parameters must already exist in the table's query. |
| Auto Reload, Reload Every | Reloads the table at this interval. On, every minute, by default. |
| Ignore Master | On: this entry ignores SQL Filter+ selections and delivers every row. Off by default. See Filter the rows with SQL Filter+. |
| Remove table | Removes the table from the symbol and from what the document receives. |
Code
Code source, Edit code, Allow writes, Confirm every write and Allow time range work as in Code and Code editor of the Custom Visualization+ guide. The code editor adds Include sample rows: the next copy of the prompt includes up to 5 rows of each table, then the box is off again.
Parameters
One row per setting the document declares. See Parameters in the Custom Visualization+ guide.
Filtering
Channels for the selections and filters the document declares. See Filtering in the Custom Visualization+ guide.
Style
Theme, Surface and Container Style. See Style in the Custom Visualization+ guide.
Document API
A document has every function in the Custom Visualization+ document reference, plus the rows of the tables. Copy AI prompt gives the AI this text for this symbol.
| Member | What it does |
|---|---|
vlp.onRows(fn) | Calls fn with a row set once per table already loaded, then whenever a load changed that table. Rows can arrive before or after the first vlp.onData. |
rowset.name | The table's Name. |
rowset.columns | The columns in order, each with name and type. |
rowset.rows | One object per row, keyed by column name, such as row["MD(Mt)"]. |
rowset.rowCount | The rows that match the SQL Filter+ selection; with no selection, the rows of the table. |
rowset.totalCount | The rows of the table before the selection. |
rowset.truncated | true when more than 10,000 rows match, so only the first 10,000 are in rows. |
rowset.loadedAt | When the delivered rows were read. |
rowset.error | null, or a short text saying why the last load failed. No matching rows is not an error. |
Example document
The document of Track a live value against a table of points:
<!DOCTYPE html>
<html>
<head>
<style>
  html, body { margin: 0; height: 100%; overflow: auto; font-family: var(--vlp-font-family); color: var(--vlp-foreground); }
  table { width: 100%; border-collapse: collapse; font-size: 13px; }
  th, td { padding: 4px 6px; text-align: left; border-bottom: 1px solid var(--vlp-divider); }
  tr.done { color: var(--vlp-text-muted); }
  #note { padding: 4px 6px; font-size: 12px; color: var(--vlp-text-muted); }
</style>
</head>
<body>
<div id="note">Loading...</div>
<table><thead><tr><th>Stage</th><th>MD</th><th>State</th></tr></thead><tbody id="rows"></tbody></table>
<script>
(function () {
  var body = document.getElementById("rows");
  var note = document.getElementById("note");
  var plugs = null;
  var payload = null;
  function draw() {
    // Either can arrive first: draw from what is there.
    var well = payload && payload.sources[0] ? payload.sources[0].value : null;
    var depth = payload && payload.sources[1] && payload.sources[1].good ? payload.sources[1].value : null;
    body.textContent = "";
    var rows = plugs ? plugs.rows.filter(function (row) { return row.Well === well; }) : [];
    rows.forEach(function (row) {
      var tr = document.createElement("tr");
      var done = typeof depth === "number" && depth >= row["MD(Mt)"];
      if (done) tr.className = "done";
      [row.Stage, vlp.formatNumber(row["MD(Mt)"]), done ? "Done" : "Open"].forEach(function (text) {
        var td = document.createElement("td");
        td.textContent = text;
        tr.appendChild(td);
      });
      body.appendChild(tr);
    });
    if (!plugs) note.textContent = "Loading...";
    else if (plugs.error) note.textContent = plugs.error + (plugs.rows.length ? " Showing the last rows read." : "");
    else if (plugs.truncated) note.textContent = "Showing the first " + plugs.rows.length + " of " + plugs.rowCount + " rows.";
    else note.textContent = rows.length + " of " + plugs.rows.length + " rows";
  }
  vlp.onRows(function (rowset) {
    if (rowset.name !== "plugs") return;
    plugs = rowset;
    draw();
  });
  vlp.onData(function (data) {
    payload = data;
    draw();
  });
})();
</script>
</body>
</html>
Troubleshooting and limitations
| Symptom | Cause | What to do |
|---|---|---|
| The symbol stays empty, even with the starting example. | The frames folder is missing on the PI Vision server. | Ask the administrator to copy it as described in the installation and administration guide. |
| "This table is not loaded: a name starts with a letter and has up to 40 letters, digits or _." | The Name breaks the rule. | Correct the name, and use the same name in the document. |
| "This table is not loaded: another table already has this name." | Two tables have one Name. | Rename one. |
| "This symbol needs one data source: tables reload on PI Vision's data updates. Without one the document still runs, but its tables do not reload." | The symbol has no data source. | Drag a data source onto the symbol. |
| The AF table "..." was not found in ..., or could not be read. | The table does not exist under that name in the asset's database, was renamed, or cannot be read. | Add or rename the table in AF, or choose it again under AF Table. |
| Add table is unavailable. | The symbol has 5 tables. | Remove one, or place a second symbol. |
| The view shows too few rows, or none. | A SQL Filter+ selection on the table, the document's own filter, or column names that differ from the table's. | Clear the selection, or turn Ignore Master on. Otherwise select Run, read Output, and ask for a fix with Copy AI prompt (change). |
| The view shows nothing when a table fails. | The document does not handle the error. | Ask the AI to show the row set's error. |
| A code, write or time range problem. | See the other guide. | See Troubleshooting and limitations in the Custom Visualization+ guide. |
Limitation: A symbol reads at most 5 tables and at most 10,000 rows per table.
Limitation: Tables are read only. A document can write only to its data sources.
Limitation: The symbol needs one data source, or its tables do not reload.
Limitation: Software Athlete supports the symbol and its document functions. You own the code of generated documents and its correctness on live operations.


