



Vision Library+ / Charts and analytics
Sankey+
Sankey+ shows the magnitude and direction of flows between configured nodes. Use it to visualize material, energy, utility, or cost flows through a process.
Overview
Sankey+ shows the magnitude and direction of flows between configured nodes. Use it to visualize material, energy, utility, or cost flows through a process.
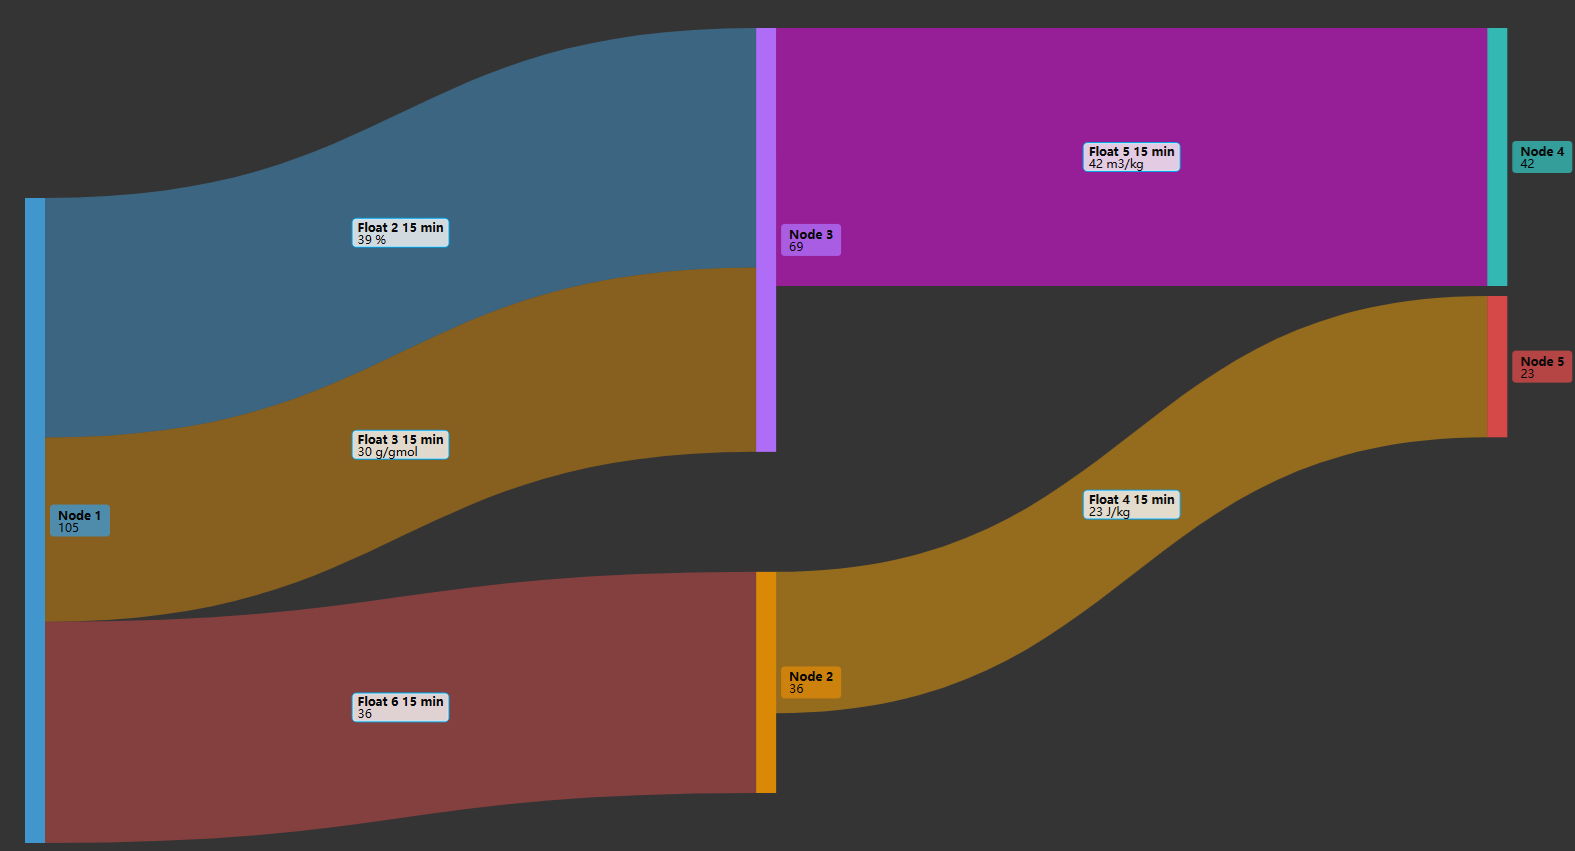
Watch the demo
See Sankey+ in a practical PI Vision workflow.
When to use it
Use Sankey+ when you need to:
- Show how a total is distributed between process stages.
- Compare the relative magnitude of several flows.
- Combine live process values with fixed reference flows.
- Identify where material, energy, or cost is gained or lost.
Use a standard process graphic when connectivity matters but flow magnitude does not.
Before you begin
- Identify every node in the flow network.
- Prepare one numeric data source for each live flow.
- Decide the start and end node for every flow.
- Remove cycles from the planned network; cyclical flows are not supported.
Add and set up the symbol
- Select Sankey+ in the PI Vision symbol gallery.
- Drag the numeric flow data sources onto the display.
- Open the configuration pane and create the required nodes.
- Assign a start node and end node to each data source.
- Add fixed flows when part of the diagram should use a constant value.
- Confirm that every flow appears in the expected direction.
Use the symbol
Read flow width as relative magnitude and follow each band from its start node to its end node. Use the configured node and flow labels to identify names, values, units, and direction. Click a live flow to open it in a Quick Trend window.
The chart toolbar appears at the top right when the pointer or the keyboard focus enters the diagram, and hides shortly after it leaves. Set Toolbar > Reveal to Always to keep it in view; the diagram then keeps a band of its area free so the buttons never cover a flow. On a touch device the toolbar is always shown. The toolbar carries Fullscreen and Download. Sankey+ has no zoom, so it has no zoom buttons.
Fullscreen opens the same diagram in a larger window without requesting data again, and carries the same toolbar without the Fullscreen button.
Use Download to open the export menu: PNG, SVG and PDF diagram views, or CSV, JSON and XLSX flow data. This is new in this release; earlier versions of Sankey+ could not export at all. Files are named <symbol name>-<yyyyMMdd-HHmmss> with the format's extension, using your local clock. A data export writes one row per flow - live flows first, then static flows - carrying Source, Target, Flow (the flow's own name), Value (the number the diagram draws) and Units. A live flow and a static flow have the same columns. Node values are not exported separately because a node's value is the sum of the flows through it; sum the value column by start node or end node to recover it. Flows whose start or end node is missing are left out, exactly as they are left out of the diagram. When the administrator disables data exports, the menu keeps the image formats and drops CSV, JSON and XLSX.
Configure the symbol
Nodes and flows
Nodes represent process stages. Flows connect those stages, and their widths are based on the associated value.
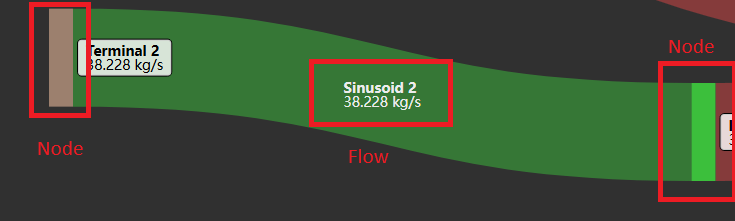
Individual nodes
- Name: Sets the displayed node name.
- Color: Sets the node color.
- Label: Shows or hides the node name and value.
- Height: Sets an individual label height when node-label height is Custom.
- Node position: Moves the node when the general position mode is Custom.
Node layout
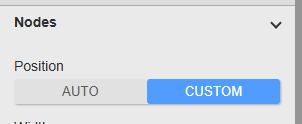
- Position: Uses automatic placement or allows individual X and Y positions.
- Width: Sets the width of every node.
- Distance: Sets the spacing between nodes.
Live flows
- Label: Sets the displayed flow name.
- Value type: Uses the current value or a supported summary such as average, minimum, or maximum.
- Start: Selects the source node.
- End: Selects the destination node.
- Show label: Shows or hides the flow label.
Limitation: Sankey+ does not support cyclical flows. When a cycle is detected, the affected flow is not displayed and the symbol reports an error.
Static flows
- Name: Sets the fixed flow name.
- Value: Sets its constant magnitude.
- Color: Sets the flow color.
- Start and end: Select the connected nodes.
- Label: Shows or hides the static-flow label.
Node labels
- Show: Shows or hides all node labels.
- Name / Value: Selects the fields displayed in a label.
- Units: Selects a unit available from the configured data sources.
- Color: Uses one custom color or the associated node color.
- Opacity: Sets label opacity.
- Position: Places the label to the right, left, bottom, top, or inside the node.
- Height: Uses automatic height or an individually configured custom height.
Flow labels
- Show: Shows or hides all flow labels.
- Direction: Adds an arrow showing flow direction.
- Name / Value: Selects the fields displayed in a label.
- Color: Sets the label background color.
- Opacity: Sets the label background opacity.
Toolbar
- Show: Turns the chart toolbar on or off. With it off nothing is drawn and no diagram area is reserved.
- Reveal: Chooses between showing the toolbar on hover and showing it always. Always also reserves a band of diagram area for the toolbar, minus whatever the title already clears.
Screenshots in this article predate the toolbar.
Troubleshooting and limitations
- A flow is missing: Confirm its start and end nodes and check whether it creates a cycle.
- Flow widths are unexpected: Verify the selected value type and the units of the associated data sources.
- Nodes overlap: Increase node distance or switch to custom positioning.
- Labels overlap: Change label positions, reduce displayed fields, or increase the symbol size.



