


Custom Visualization+
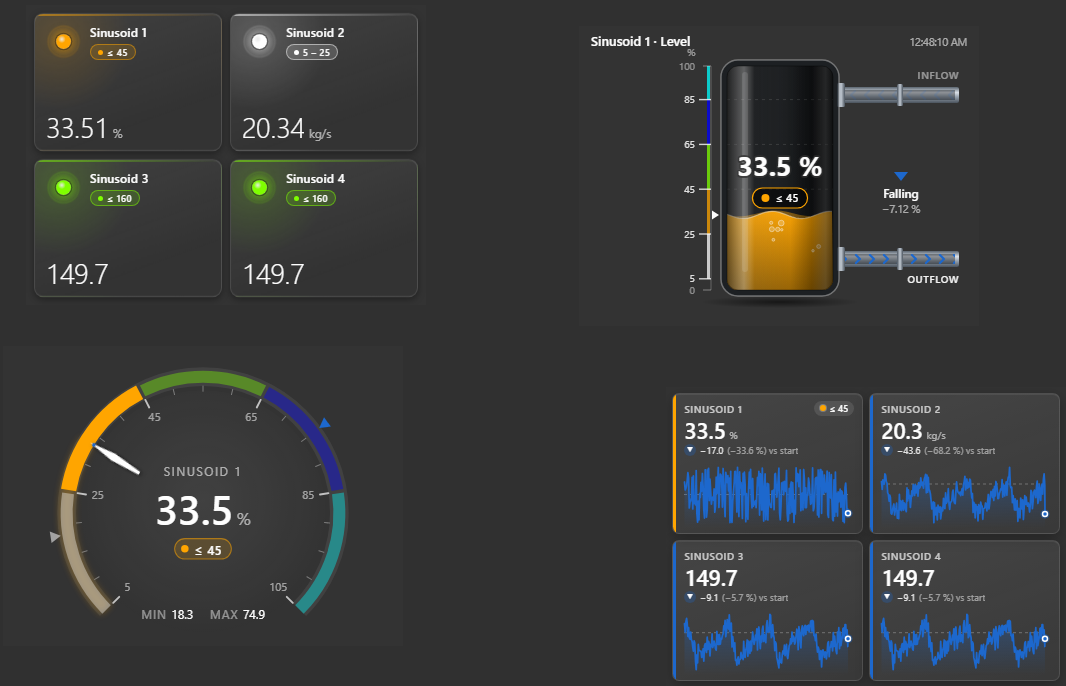
Custom Visualization+ shows a visualization that you write yourself, or let an AI write, as one HTML document, fed with the live values of the symbol's data sources. A tank, a P&ID mimic, a status board or an operator panel becomes display content instead of a server installation.
Overview
When to use it
Use this symbol when you need to:
- Show process values in a form no other symbol offers, such as a tank, a mimic or a plant-specific status board.
- Have an AI write the visualization from a description, without programming skills.
- Reuse one visualization on many displays and assets, with settings per placement.
- Let a click in the visualization zoom the display to a period or filter other symbols.
- Give operators buttons and entry fields that write values to PI.
Choose a ready-made symbol, such as Combo Chart+ or KPI Card+, when it already shows what you need. For the rows of AF tables, choose Custom SQL Visualization+.
Before you begin
- The administrator has installed the
framesfolder with Vision Library+. Without it the symbol stays empty. See "Install the Vision Library+ Files" in the installation and administration guide. - The administrator can limit the code editor to PI Vision administrators and can block writes for the whole site. See "Configure Custom Visualization+" in the installation and administration guide.
- Any PI Point or AF attribute can be a data source.
- To store the code in AF, use a String attribute without data reference. Saving code there needs AF write permission.
- To write values, operators need write permission on the PI Points or AF attributes.
Add and set up the symbol
- Select Custom Visualization+ in the PI Vision symbol gallery and drag one or more data sources onto the display. The symbol shows a starting example: a table of the data sources with value, units and time.
- Right-click the symbol and select Configure Custom Visualization+....
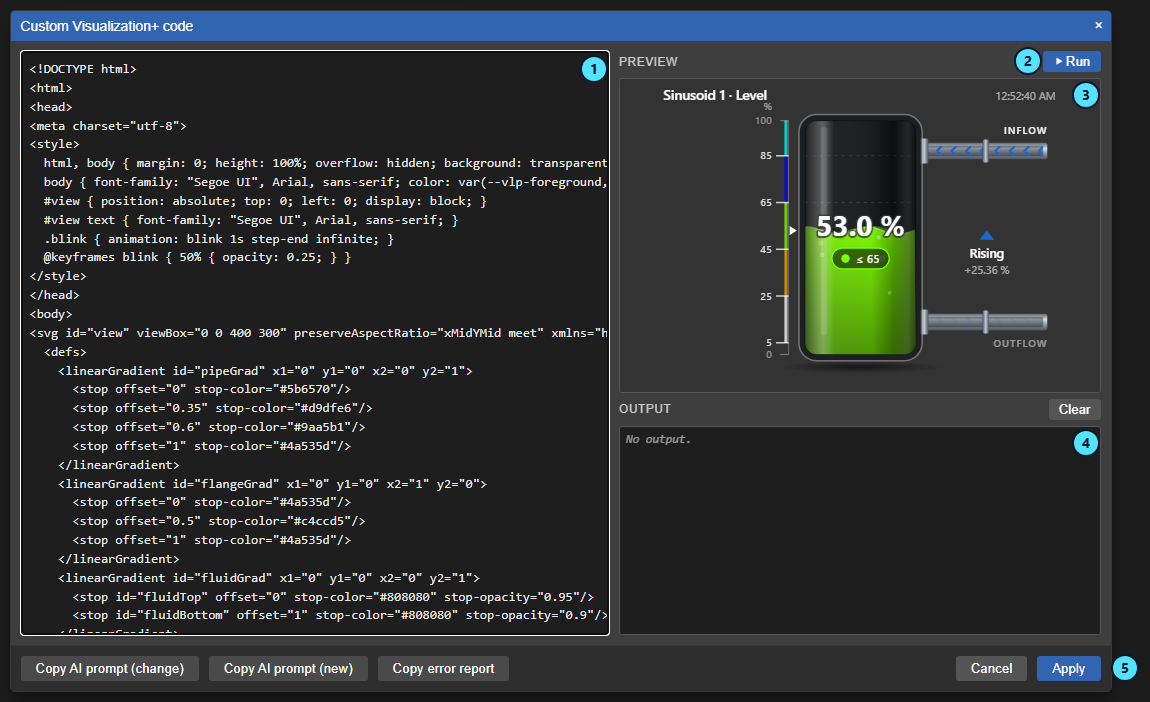
- Under Code, select Edit code. The code editor shows the document (1), a Preview (3) and an Output console (4).
- Replace the code with your document, for example one an AI wrote for you (see the next task).
- Select Run (2) or press Ctrl+Enter. The preview runs the draft on the symbol's current data, and messages and errors appear under Output.
- Select Apply (5), close the pane and save the display. The symbol now shows your visualization.
Common tasks
Get a document from an AI
Use this when you can describe the visualization in words but do not want to write the code.
- Right-click the symbol, select Configure Custom Visualization+..., and select Edit code.
- Select Copy AI prompt. When the code area holds your own document, the button is split into Copy AI prompt (change) (1) and Copy AI prompt (new) (2).
- Paste the copied text into your AI chat and add your request, for example "A tank that fills with the level of the first source, with the limits as colored bands."
- Paste the AI's answer into the code area, select Run, and check Output for errors.
- Select Apply, close the pane and save the display.

Copy AI prompt (change) adds your current document, so the AI changes it instead of starting over. On an error, Copy error report (3) copies the document and the output console for the AI to fix. The document reference shows the copied text.
Write a request that gets a good result
Use this when you add your request to the copied prompt. The prompt already carries the labels, units, states and limits of the data sources, the theme, and the viewer's formats and time zone, so do not repeat them.
- Name the data sources by position or label: "the first source", "the source Feed flow".
- Say what to show and over which period: the current value, the trend over the display time range, or the hourly average.
- Name every value that should be adjustable per symbol, such as a title, limits or a color. The AI declares them as settings, which appear under Parameters.
- Say what a click does: zoom the display to a day, select a source for other symbols, or nothing.
- Say whether the document writes, and to which source.
- Name the caption languages and the rough size, for example "English and German, a 300 by 200 tile".
Example requests:
- "Daily average bars of every source. A click on a day zooms the display to that day and selects that source for other symbols."
- "A set point panel for the second source: an entry field and a Write button that shows the result. Make the title adjustable."
- "The hourly minimum, average and maximum of the first source as a band, the running hour dashed."
To refine a document, ask for one change at a time with Copy AI prompt (change). Test buttons and clicks in the preview, which never writes, and compare a few numbers with a PI Vision trend before you apply.
A document loads nothing from the network, so ask for drawings in SVG instead of external images or fonts. Nothing animates when data updates. A document reads only the symbol's own data sources over the display time range: at most 5,000 history values per source and 1,000 summary intervals per call, so ask for daily figures over long periods.
An AI wrote all documents below.
Store the code in an AF attribute
Use this to keep one document for many displays, to let the code follow the display asset, or for a document longer than 256,000 characters.
- Right-click the symbol and select Configure Custom Visualization+....
- Under Code, select AF attribute for Code source (1).
- Drag the String attribute from the asset tree or the search results onto Code attribute (2), or paste its path and press Enter.
- Turn Relative to the display asset on (3) when each asset carries its own code.
- To change the code, select Edit code (4), then Save to AF, and confirm.
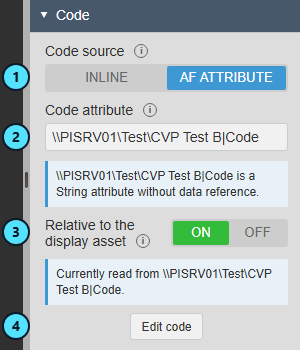
The symbol now runs the code stored in the attribute. Save to AF changes every display that uses the attribute, which is why it asks first; open displays read the change when they are opened again or switch asset. When someone else changed the attribute in the meantime, nothing is saved and Reload loads the current code.
Place one document several times with its own settings
Use this when the same visualization appears for several lines or units, each with its own title, limits or color. The document must declare these settings as parameters.
- Select the symbol, right-click it and select Configure Custom Visualization+....
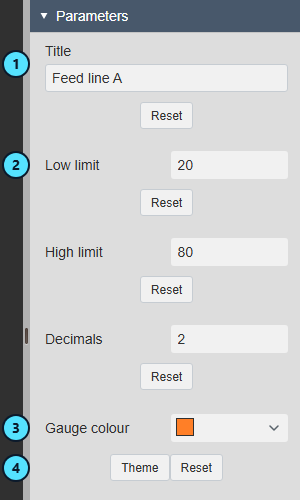
- Expand Parameters. It shows one row per setting the document declares, with the labels the document gives them (1).
- Enter a value and press Enter or leave the field (2). The symbol updates at once.
- Pick a color (3). Theme (4) returns the color to the symbol's theme, and Reset returns any setting to the document's default.
- Repeat for each placement, then save the display.
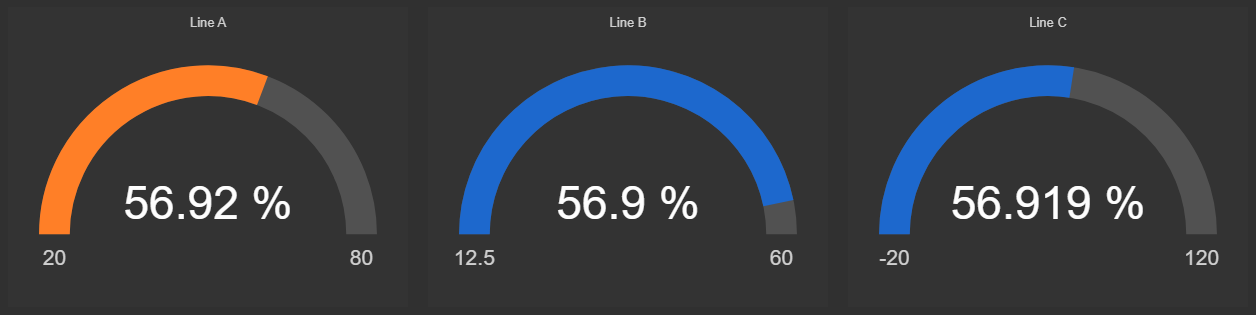
Three placements of one gauge document, each with its own title, limits, decimals and color:
Let a click change the time range and filter other symbols
Use this when a click on a day, an hour or a row should zoom the whole display to that period, or filter other symbols. The document decides what a click does; the pane decides whether it may.
- Right-click the symbol and select Configure Custom Visualization+....
- Under Code, turn Allow time range on (1).
- Expand Filtering and select + Add Output. Enter a Channel name (2) and select the document's selection as Source (3).
- In each symbol that should follow, add a Linked Input on the same channel, as described in "Configure a Linked receiver" in Filtering dashboards. Another Custom Visualization+ offers the filters its document declares.
- Save the display.
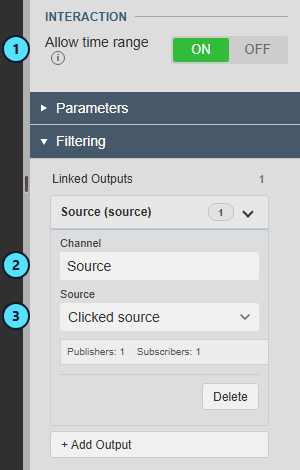
In view mode, a click on the third day of Demo|Sinusoid 3 marks the source (1) and moves the display to that day. The document offers Clear selection (2), and the second visualization (3) shows only the selected source.

The time bar shows the selected day; operators go back with it.

Let operators write values
Use this for an operator panel that writes a set point, a mode or a note.
- Right-click the symbol and select Configure Custom Visualization+....
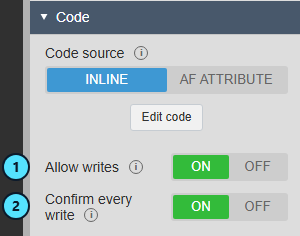
- Under Code, turn Allow writes on (1). Confirm every write (2) is on and asks the operator before each write.
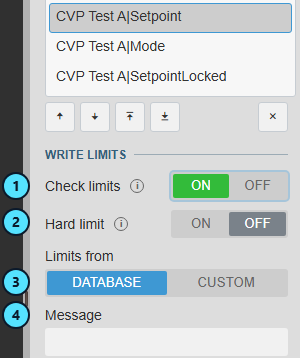
- To check values, expand Datasources and select a numeric data source. Turn Check limits on (1), choose Hard limit (2), choose Limits from Database or Custom (3), and enter a Message (4).
- Close the pane and save the display.
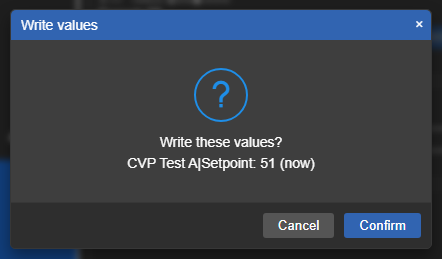
When an operator selects a write button of the document, the Write values dialog lists each value and time. Confirm writes, Cancel writes nothing.
Use the symbol
What an operator sees and can do is defined by the document. The operator panel below writes a set point.
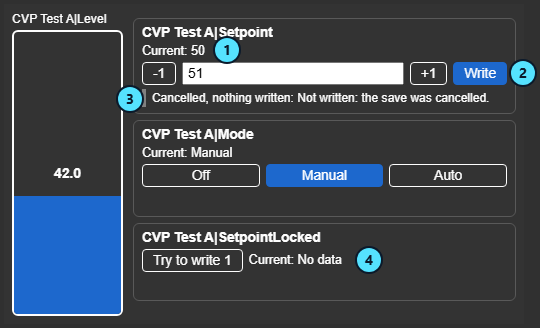
| What it shows | |
|---|---|
| (1) | A current value of a data source. It updates with every PI Vision data update. |
| (2) | A control the document draws. Here Write asks to write the entered value. |
| (3) | The result the document reports. Here the operator cancelled the confirmation, so nothing was written. |
| (4) | A data source without a value. The document shows its own no-data state. |
- Hover, click and keys do what the document provides, such as tooltips, a selection that filters other symbols, a zoom of the display time range or a write.
- Writes need the operator's PI or AF write permission and are confirmed in the Write values dialog unless the author turned that off.
- Asset switch: labels and values follow the display asset.
- Navigation link: with a navigation link (Add Navigation Link...), a click opens the link and the visualization takes no mouse input.
- Edit mode: clicks select the symbol; the visualization does not react to them.
- Errors of a document go to the PI Vision log, never into the display. Select Run in the code editor to see them under Output.
Security: the document runs in an isolated frame. It cannot reach the network, PI Web API or the PI Vision page, sees only the data of its own data sources and writes only to them.
Configure the symbol
Right-click the symbol and select Configure Custom Visualization+.... The pane has the groups Datasources, Code, Parameters, Filtering and Style, followed by the standard Web API, License Status, Help and About groups.
Data sources
| Setting | What it does |
|---|---|
| Data source list | The data sources in the order the document reads them (first, second, ...). Reorder or remove them with the buttons below the list. |
| Check limits | Checks every write to the selected numeric data source against limits. Off by default. Available when Allow writes is on. See Let operators write values. |
| Hard limit | On: a value outside the limits is refused. Off: the operator is asked to confirm it. Available when Check limits is on. |
| Limits from, Min, Max | Database uses the minimum and maximum of the PI Point or attribute. Custom uses Min and Max. Available when Check limits is on. |
| Message | Text shown when a value is outside the limits. Available when Check limits is on. |
Multi-state
Right-click the symbol and select Configure Multi-State... to give a data source PI Vision's own multi-state. The symbol evaluates the states; the document receives the color, blink and name of the current state and paints them.
Code
| Setting | What it does |
|---|---|
| Code source | Inline stores the document in the symbol, up to 256,000 characters. AF attribute reads it from an AF String attribute. See Store the code in an AF attribute. |
| Code attribute | The attribute that holds the code. Drag it onto the field or paste its path and press Enter. Available when Code source is AF attribute. |
| Relative to the display asset | On: the attribute of the same name on the asset the display shows. Off: always the attribute above. Available when Code source is AF attribute. |
| Edit code | Opens the code editor. Unavailable, with a note, when the administrator allows code editing to PI Vision administrators only. |
| Allow writes | Lets the document write to the symbol's own data sources. Off by default. Shown only to users who may edit the code; disabled when the administrator blocks writes for the site. Each write is recorded in the PI Vision log. |
| Confirm every write | Asks the operator before each write. On by default. Values outside soft limits are always confirmed. Available when Allow writes is on. |
| Allow time range | Lets a click in the document move the display time range. Off by default. See Let a click change the time range and filter other symbols. |
Code editor
| Control | What it does |
|---|---|
| Code area | The HTML document. Tab inserts a tab character; Escape cancels. |
| Run | Runs the draft in the preview. Ctrl+Enter does the same. Each run clears Output. |
| Preview | The draft on the symbol's current data. It never writes, never moves the time range and never filters other symbols. |
| Output, Clear | Messages, warnings and errors of the draft, with their line numbers, and problems in its parameter declarations. |
| Copy AI prompt, Copy AI prompt (change), Copy AI prompt (new) | Copy instructions for an AI, with the live context of this symbol; (change) includes the current document. See Get a document from an AI. |
| Copy error report | Copies the document and the output console for an AI or for support. |
| Apply, Cancel | Apply stores the draft in the symbol; unavailable while the draft is longer than 256,000 characters. Cancel keeps the previous code. |
| Save to AF, Reload, Restore previous | Replace Apply when Code source is AF attribute. Save to AF asks for confirmation. Reload loads the current attribute value after a conflict. Restore previous puts back the code a save replaced. |
Parameters
One row per setting the document declares: a text field, a number field, an on/off toggle, a list or a color picker, labeled by the document in the viewer's language when the document provides it. Reset returns a setting to the document's default; Theme returns a color to the theme. When the document declares no settings, the group says so. See Place one document several times with its own settings.
Filtering
Linked Outputs map each selection the document declares to a channel; Linked Inputs map each filter it declares to a channel other symbols publish. See Filtering dashboards.
Style
Theme, Surface and Container Style set the colors and font the document receives and the container drawn around it. Custom follows the display background. See Themes and container styles.
What you can ask for
Everything a request can ask for, and the setting it needs. Mention the capability in your request; the copied prompt tells the AI how to build it.
| You can ask for | Example request | Setting it needs |
|---|---|---|
| Current values with units, time and quality | "A card per source with value and unit, grayed out without a good value." | None |
| A trend over the display time range, up to 5,000 values per source | "A sparkline of the first source." | None |
| Time in state or uptime | "Time in state of the first source as a stacked bar, with the state names in the legend." | None; Configure Multi-State... adds state colors and names |
| Figures per interval: average, minimum, maximum, range, total, count, standard deviation, percent good; per day, week, shift or hour, up to 1,000 intervals and 20 sources per request | "The daily total of the second source, with days starting at 06:00." | None |
| Colors and blinking by state | "A lamp in the multi-state color of the first source." | Configure Multi-State... |
| Values adjustable per symbol: text, number, on/off, list, color | "Make the title, the high limit and the bar color adjustable." | Set under Parameters |
| A click that zooms the display | "A click on a day moves the display to that day." | Allow time range |
| A click that filters other symbols | "A click on a row selects that asset for other symbols." | A Linked Output under Filtering, and a Linked Input in each receiving symbol |
| Filtering by a selection in another symbol | "Show only the assets selected in Asset Filter+." | A Linked Input under Filtering |
| Writing values, up to 20 in one action; digital sources by state name | "An Auto / Manual switch that writes the first source." | Allow writes and write permission for the operator |
| Check of written values against limits | "Show the message when a write is refused." | Check limits on the data source |
| Numbers and times in the viewer's format and the display time zone | "Show the time of each value with the date." | None |
| Captions in several languages | "Captions in English and German." | None |
| Theme colors and font, following a theme change | "Mark values above the limit in the theme's warning color." | Theme under Style |
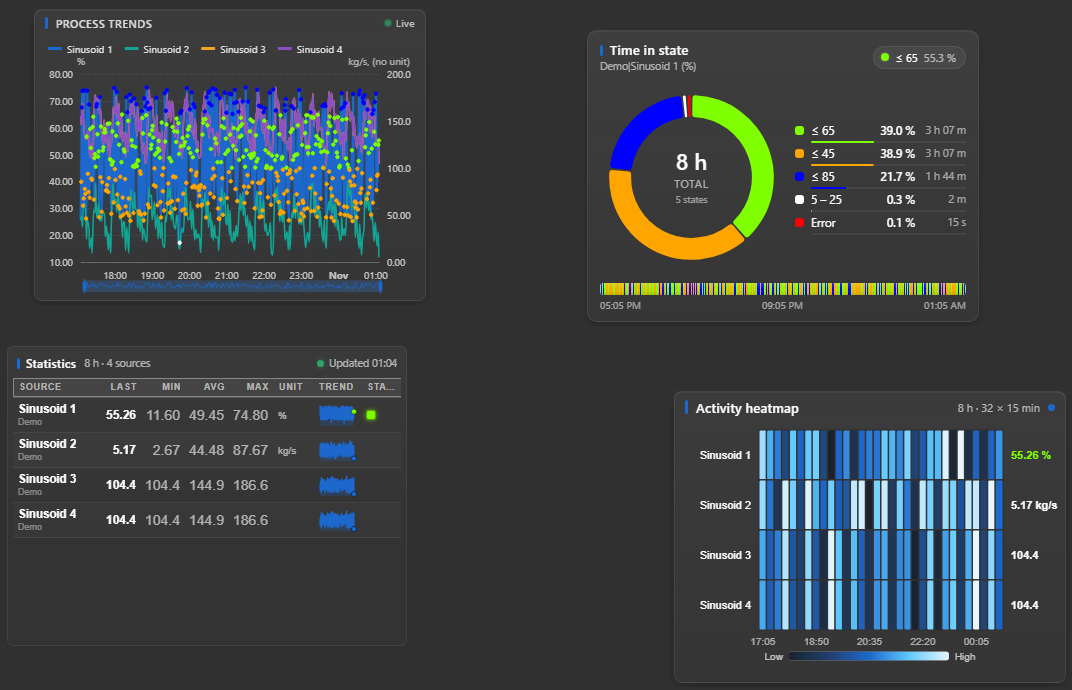
| Charts with the bundled Apache ECharts 6.0.0 | "An ECharts bar chart of the current values." | None |
| Tables with the bundled Tabulator 6.3.0 | "A sortable Tabulator table of all sources." | None |
| One document per asset, side by side | "A compact tile that stays light in a collection." | Convert to Collection... |
| A document longer than 256,000 characters | "Embed this 300 KB SVG drawing." | Code source set to AF attribute |
Document API
The functions and data a document can use, for authors who read or write the code. The Custom Visualization+ document reference holds the complete text with examples, exactly as Copy AI prompt gives it to the AI.
| Member | What it does |
|---|---|
vlp.onData(fn), vlp.onResize(fn), vlp.onTheme(fn) | Call fn on every data update, resize and theme change. |
vlp.history(options), vlp.summary(options) | History and PI summaries of the symbol's own sources over the display time range. |
vlp.write(items, options) | Writes values to the symbol's own sources, only from a click or key. |
vlp.setTimeRange({ start, end }), vlp.select(name, values) | Move the display time range and publish a selection, only from a click or key. |
vlp.formatNumber(value, options), vlp.formatTime(value, style) | Format numbers and times for this viewer, as the other symbols on the display do. |
vlp.echartsTheme(), vlp.log(...) | Return an ECharts theme from the symbol's theme; write to Output. |
<script type="application/json" id="vlp-manifest"> | Declares parameters, selections and filters. |
<script src="vlp:echarts"></script>, <script src="vlp:tabulator"></script> | Load the bundled libraries. |
Troubleshooting and limitations
| Symptom | Cause | What to do |
|---|---|---|
| The symbol stays empty, even with the starting example. | The frames folder is missing on the PI Vision server. | Ask the administrator to copy it as described in the installation and administration guide. |
| The symbol stays empty or shows only part of the document. | The document has an error. | Open Edit code, select Run, and read Output. Use Copy error report to ask the AI for a fix. |
| Edit code is unavailable with "Only PI Vision administrators can edit the code of this symbol." | The administrator restricted code editing. | Ask a PI Vision administrator. |
| Allow writes is disabled with "Writes are disabled on this PI Vision site." | The administrator blocked writes for the site. | Ask the administrator. |
| A write button does nothing or reports that writing is not enabled. | Allow writes is off, or the operator lacks write permission. | Turn Allow writes on; check PI and AF security. |
| A click does not move the time range. | Allow time range is off, or the symbol has a navigation link. | Turn Allow time range on, or remove the navigation link. |
| Parameters says the code declares no parameters. | The document has no settings block, or the block has errors. | Ask the AI to add the settings; Run lists declaration problems under Output. |
Limitation: A document loads nothing from the network, and reads and writes only the symbol's own data sources over the display time range. See Write a request that gets a good result.
Limitation: Software Athlete supports the symbol and its document functions, not the code of individual documents.


