



SQL Filter+
SQL Filter+ lists the values of a column in an AF table, linked to a SQL database or static, and lets operators click values to narrow other symbols on the display.
Overview
When to use it
Use this symbol when you need to:
- Let operators narrow the rows of an AF table by the values of a column, such as Scope.
- Combine several filters on the same table.
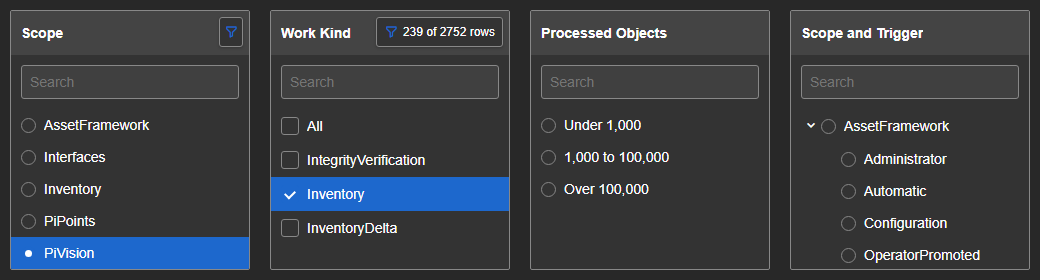
- Offer numeric bands, such as Under 1,000 and Over 100,000, instead of every distinct number.
- Drive event or asset symbols from a table value through a linked channel.
- Open one display from many links, each with the filter already set.
Choose Asset Filter+ or Event Filter+ when the values come from AF assets or event frames. Choose SQL Table+ to show the rows themselves; a SQL Table+ on the same table follows this filter.
Before you begin
- Create the AF table in the AF database, linked to a SQL database or static. The query lives in AF, not in this symbol.
- Give display viewers read access to the AF table.
- Know the attribute that places the symbol: PI Vision creates this symbol from a dragged attribute or PI tag.
Add and set up the symbol
- Select SQL Filter+ in the PI Vision symbol gallery.
- Drag an attribute from an element in the AF database that holds the table onto the display.
- Right-click the symbol and select Configure SQL Filter....
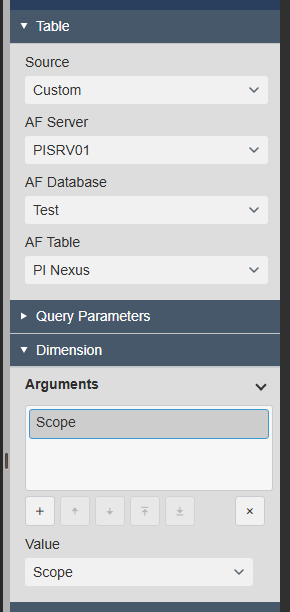
- Under Table, set AF Table to your table, such as PI Nexus. For a table in another database, set Source to Custom and choose AF Server and AF Database first.
- Under Dimension, open Arguments, select + and set Value to a column, such as Scope.
- Close the pane and click a value in the list.
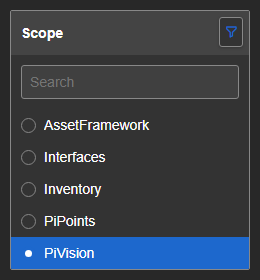
The list shows one entry per value of the column, and the clicked value is highlighted.
Common tasks
Combine two filters on one table
Use this when operators narrow a table by more than one column. Filters on the same table work together: a symbol on that table shows the rows that match every filter.
- Add a second SQL Filter+ on the same table and set Value to another column, such as WorkKind.
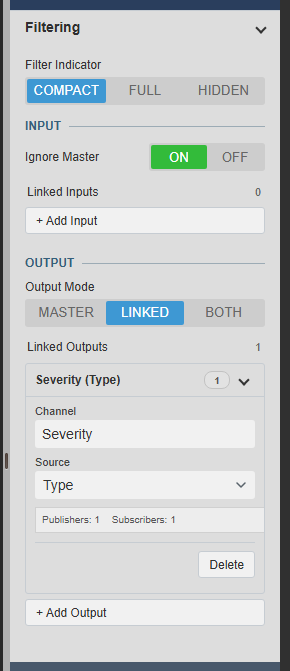
- To make its list follow the first filter, open General > Filtering and set Ignore Master to OFF.
- Set Filter Indicator to FULL to show the row count at all times.
- Click a value in the first filter.
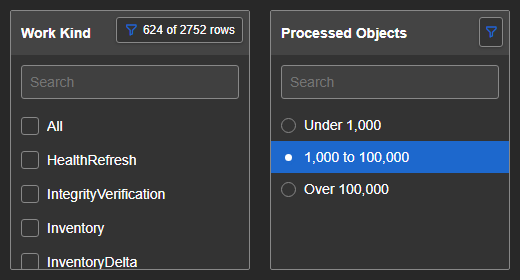
The second list offers only the values left, and its indicator shows the remaining rows, such as 239 of 2752 rows.
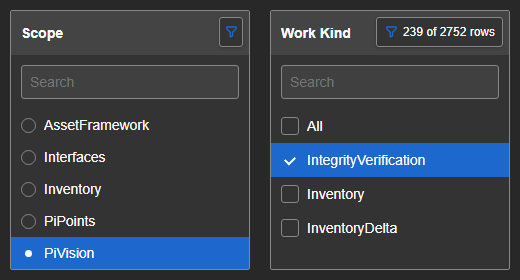
A SQL Table+ on the same table follows the filters too and shows only the matching rows. A filter on another AF table is not affected.
Filter event symbols through a channel
Use this when the symbols to filter use other data, such as event frames, and a table column holds the same values as one of their properties.
- Open General > Filtering on SQL Filter+ and set Output Mode to LINKED, or to BOTH if symbols on the same table should follow too.
- Select Add Output, enter a Channel name, such as
Severity, and set Source to the column, here Type.
- On the other symbol, open Filtering, select Add Input, enter the same Channel and set Target to the matching property, here Severity.
- Click a value in SQL Filter+.
The other symbol shows only its rows with that value, and its indicator shows the count.
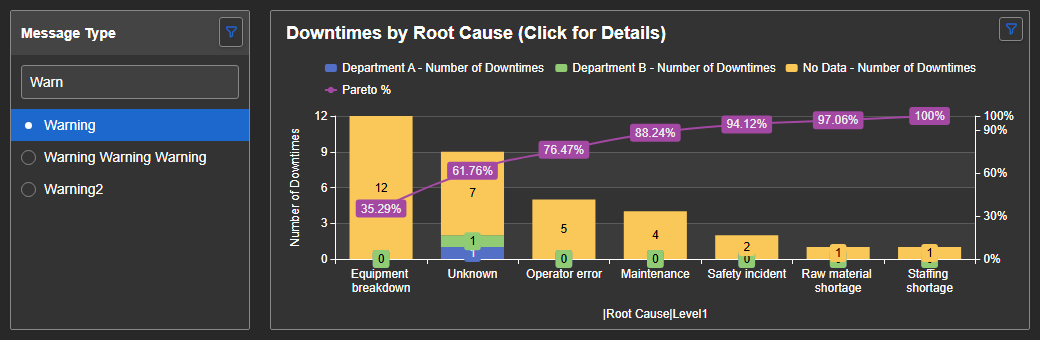
The values must match exactly, including their type. A channel carries values, so it also connects two different AF tables.
Offer numeric bands instead of values
Use this when a numeric column has too many distinct values to list.
- Open Dimension > Arguments. Keep one argument and set Value to a numeric column, such as ProcessedCount.
- Set Mode to RANGES.
- Under Ranges, select + to add a range.
- Enter a Label, then a Minimum, a Maximum or both. A range in red is invalid.
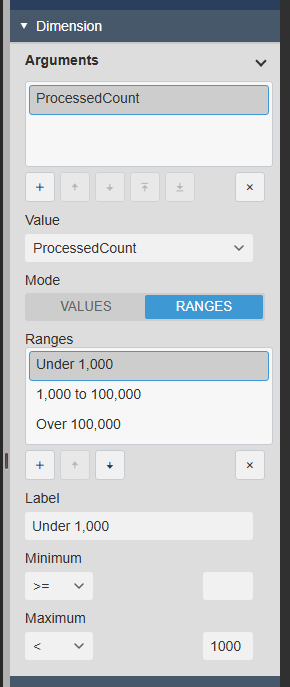
The list shows the ranges, and a clicked range narrows symbols on the same table. Ranges publish no linked channels.
Show a two-level tree
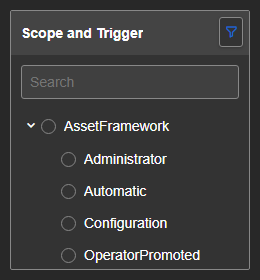
Use this when one column groups another, such as a scope and what triggered it.
- Open Dimension > Arguments and add a second column with +.
- Open General > Layout and set View to TREE.
- Set Start Expanded to ON if the tree should open with its branches visible.
Clicking a parent filters on the parent value. Clicking a child filters on both.
Open a display with a value already selected
Use this when a display should open filtered, either always or from a link.
- Open General > Selection.
- To always start with a value, set Default selection to Specific values and enter the value, or choose the last item.
- To select from a link, enter a Link parameter name, such as
Scope.
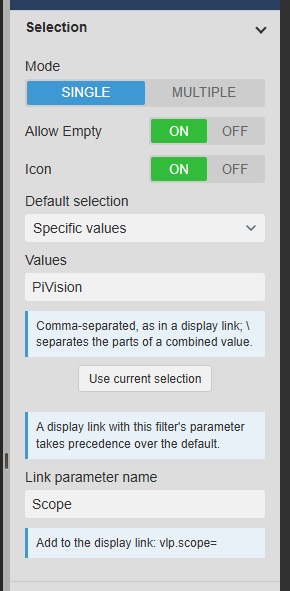
A link ending in ?vlp.scope=PiVision opens the display with PiVision selected, and a link value takes priority over the default.
Read a table by name from the asset's AF database
Use this when the same table name exists in several AF databases and the display switches between assets.
- Make an AF attribute the symbol's first data source.
- Under Table, set Source to its first option and pick the table.
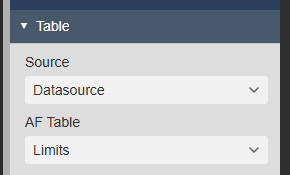
When the asset changes to another AF database, the symbol reads the table of the same name there.
Use the symbol
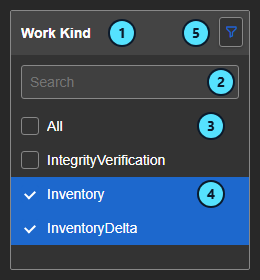
| Callout | Part | What it does |
|---|---|---|
| (1) | Header | Shows your text or the selected values. On a collapsible filter, click it to open or close the list. |
| (2) | Search | Shortens the list to the entries that contain the text. |
| (3) | All | Selects or clears every value. Multiple selection only. |
| (4) | Value | Click to select. Click again to clear. |
| (5) | Indicator | Shows that a filter is active and how many rows other filters left. Hover over it to clear this symbol's own selection. |
Selecting a value changes other symbols on the display only. It does not write to the AF table and does not change the saved display. Leaving the display clears the selection.
The list reloads with the table at the Auto Reload interval, and a selected value stays selected. While the first load runs, the symbol shows a spinner. A table without rows shows an empty list and writes an Information entry to the PI Vision log. In edit mode an empty symbol says what is still missing.
Configure the symbol
Right-click the symbol and select Configure SQL Filter....
Table
| Setting | What it does |
|---|---|
| Source | The first option reads the table by name from the first data source's AF database. Custom uses the pickers below. Available when the first data source is an AF attribute. |
| AF Server, AF Database | Where the table is. Available with Custom, and always for a symbol without an AF attribute. |
| AF Table | The table to read. Changing it clears the selection. |
Query Parameters
| Setting | What it does |
|---|---|
| Parameter Name | The AF table's parameter, starting with @. |
| Value Source | Display Start Time, Display End Time, Custom or a data source. Current Value shows what is sent. |
| Value | The text sent. Available with Custom. |
| Data source | The data source whose current value is sent. Available when Value Source is a data source. |
Dimension
| Setting | What it does |
|---|---|
| Arguments | The columns the list is built from. Add and remove them here. Two or more columns join their values with a dash, or form a tree. |
| Value | The column of the selected argument. A column the table does not have shows as not in this table and offers no entries. |
| Group Interval | Groups a date and time column, for example by month. Available for a DateTime column. |
| Mode | VALUES lists the distinct values. RANGES lists your ranges. Available with one numeric column. See Offer numeric bands instead of values. |
| Ranges | Label, Minimum and Maximum of each band. Available with RANGES. |
General
| Setting | What it does |
|---|---|
| Auto Reload, Auto Reload Interval | Reads the table again at this interval. The default is 1 minute, and 5 seconds is the shortest. |
| Type | STATIC always shows the list. COLLAPSIBLE folds it under the header. |
| Collapse On Select, Start Expanded | Closes the list on a click and opens it on load. Available with COLLAPSIBLE. |
| View, Start Expanded | LIST or TREE. Start Expanded opens the branches. See Show a two-level tree. |
| Mode (Selection) | SINGLE or MULTIPLE. Multiple adds checkboxes and All. |
| Allow Empty | ON lets a click clear the only selected value. OFF keeps one value selected and starts with the first. Available with SINGLE. |
| Icon | Shows radio buttons or checkboxes. |
| Default selection, Link parameter name | See Open a display with a value already selected. |
| Theme, Surface, Container | The symbol's look. Background and Text appear with the Custom theme. |
| Padding, Font, Font Size | Row spacing and text. |
| Header, Text | Shows the header, with your text or the selected values. |
| Search, Placeholder | Shows the search box and its hint. |
| Filter Indicator | COMPACT, FULL or HIDDEN. |
| Ignore Master, Linked Inputs | Whether other filters on this table, and linked channels, narrow the list. |
| Output Mode, Linked Outputs | What a click publishes: MASTER to symbols on this table, LINKED to channels, or BOTH. See Filter event symbols through a channel. |
Data sources
| Setting | What it does |
|---|---|
| Data source list | The data sources of the symbol, with their current values. They feed the table source and the parameters. Delete the last one to make the symbol read on its own timer. |
Troubleshooting and limitations
| Symptom | Cause | What to do |
|---|---|---|
| The list is empty | No table or column is picked, or the table has no rows. | Open the pane. In edit mode the symbol says what is missing. Check the PI Vision log. |
| The list is empty after a table change | The saved column is not in the new table. | Pick a column of the new table under Value. |
| A column is missing from Value | Its name contains a vertical bar or is reserved for the symbol's own use. | A Warning in the PI Vision log names it. Rename the column in a view or in the AF table. |
| Other symbols do not narrow | They use another AF table. | Use a linked channel. |
| A channel selects nothing | The values or their type differ. | Compare the column with the target property. |
| The log shows Loading Data Failed | The AF table, its query or a parameter failed. | Read the message, and test the table in PI System Explorer. |
Limitation: The symbol reads every row of the AF table in the browser. PI Web API offers no paging for AF tables, so a very large table takes longer to load and writes an Information entry to the log.
Limitation: PI Vision places this symbol from a dragged attribute or PI tag. Delete that data source in the pane if the symbol does not need it.


