



Vision Library+ / Tables and monitoring
Asset Comparison Table+
Asset Comparison Table+ compares selected attributes across a configurable set of AF assets.
Overview
Asset Comparison Table+ compares selected attributes across a configurable set of AF assets.
Watch the demo
See Asset Comparison Table+ in a practical PI Vision workflow.
When to use it
Use this symbol when you need to:
- Review the same measurements for many assets in a compact table.
- Select or edit asset-specific values when those options are enabled.
Before you begin
- Prepare AF assets based on a common element template.
- Confirm write permissions before enabling editable columns.
Add and set up the symbol
- Select the symbol in the PI Vision symbol gallery.
- Add the required data sources or asset context to the display.
- Right-click the symbol and open its configuration pane.
- Configure the minimum data, range, and display settings for a useful result.
- Confirm that the symbol shows the expected data.
Use the symbol
Select an asset or cell to use the configured navigation or editing action. Saving an edit writes the new value to its data source.
Configure the symbol
Overview and behavior
The Asset Comparison Table+ extends the default Asset Comparison Table with transposed views, filtering, grouping, data export, asset hierarchy navigation, and more.
The table displays assets and their attributes together in a single view.
Configuring selectable assets
There are two ways to populate the Asset Select+ control with assets. The first is a static asset list: drag assets directly onto the control to choose which assets appear. Each asset’s display label can be customized in the Assets section.
To load assets dynamically, right-click the control and select Add Dynamic Search Criteria…
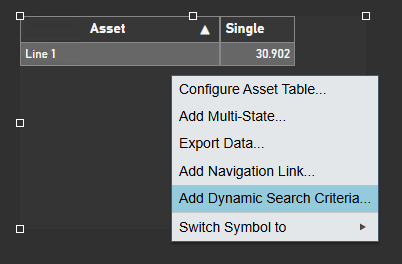 | => | 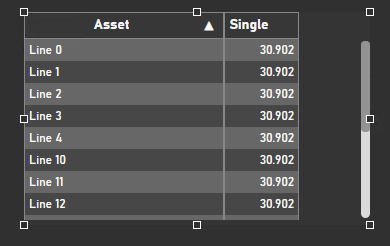 |
The search criteria pane on the right lets you search and filter available assets.
The Search Criteria pane supports the following filters:
- Database
- Search Root
- Asset Name
- Asset Type
- Asset Category
- Number of Results
- Asset Order
Click Refresh to update the asset list. If expected assets are not appearing, verify that Return All Descendants is enabled in the Search Root settings and that the Number of Results is set high enough.
General configuration
- Under Table, configure the following basic table settings:
- Mode: Choose between Read Only and Edit. In Edit mode, users can update attribute values directly in the table.
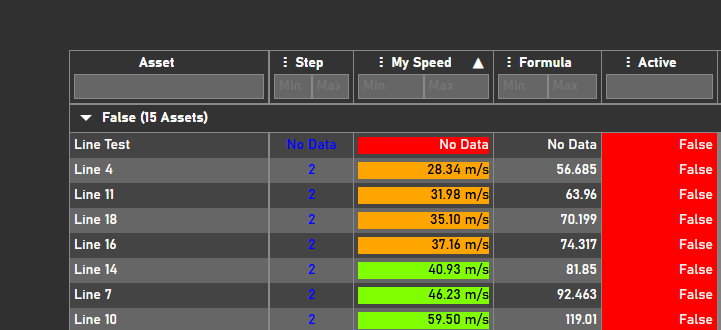
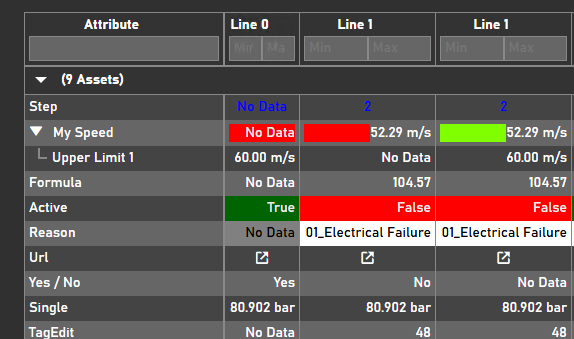
- Orientation: Choose between Vertical and Horizontal. In Vertical orientation, assets appear as rows and attributes as columns; in Horizontal orientation, the layout is reversed.
Vertical Horizontal
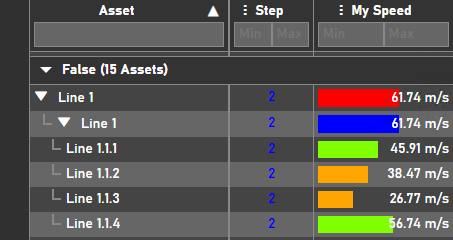
- Columns: Select from three column-width layout modes:
| Manual | Manually resize columns and save the column widths. |
| Fit Data | Sizes each column to fit its content. |
| Fit Table Width | Expands columns to fill the full table width. |
- Right to Left: Display all table text in right-to-left reading order.
- Asset: Show or hide the asset column.
- Label (Asset): Set a custom label for the asset column.
- Under Header, configure the following column header settings:
- Show: Show or hide the column headers.
- Alignment: Set the horizontal alignment of column header text.
- Filter: Enable or disable per-column data filters.
- Under Tree, configure asset hierarchy display. When assets have parent-child relationships, enable the Enabled toggle to display them as collapsible tree nodes:
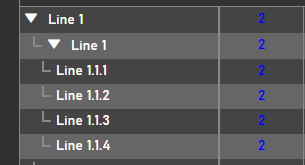
Auto Expand controls whether child nodes are expanded or collapsed on load. The Level setting defines how many levels deep the auto-expand applies.
- Under Grouping, group assets by their attribute values:
- Enabled: Enable or disable asset grouping.
- Dropdown: Select the attribute to group assets by.
- Sort: Enable or disable sorting within groups.
- Sort Order: Choose ascending or descending sort order for groups.
- Auto Expand: Start groups expanded or collapsed on load.
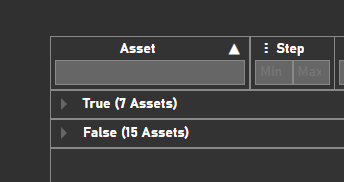
- Under Totals, configure row totals, column totals, and grand totals:
Row Totals adds calculation rows below the data; Column Totals adds calculation columns to the right. Both use the aggregation types configured below.
When both Row and Column Totals are enabled, Grand Totals can also be enabled to show a combined total.
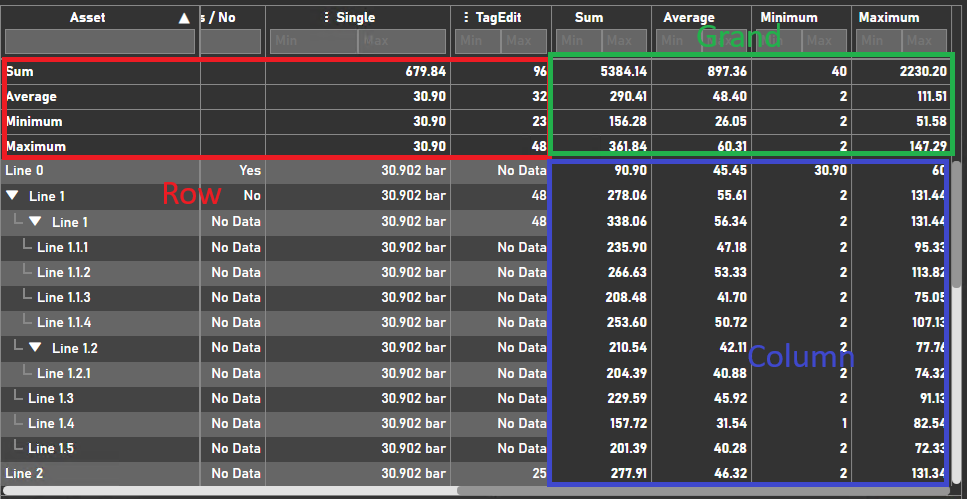
- Under Interactivity, configure what happens when users click rows or columns:
- Asset Selection: Set the asset context or open an Ad Hoc Chart when a user clicks an asset row.
- Attribute Selection: Open an Ad Hoc Chart when a user clicks an attribute column.
- Toolbar: Select which toolbar buttons to display: Download, Expand All, and Collapse All.
Attribute configuration
Use this section to add or remove attributes from the table. The following properties can be configured for each attribute:
- Show: Show or hide the attribute column.
- Allow Edit: Allow users to edit this attribute's values directly in the table. Only available when the table is in Edit mode.
- Units: Show or hide the unit of measure (UOM) in the column.
- Label: Set a custom display label for the attribute column.
- Alignment: Set the horizontal alignment of cell values.
Editing
Asset Comparison Table+ can also be used as an input control, by switching the Editing > Mode to Edit. When enabled, users can interact with the table cells and update them. The following configuration options are available:
- Allow Delete: Whether users can delete existing values
- Time: The timestamp to be used when saving a new value
- Show Input: Show the time Input
- Require Confirmation: If toggled on, the user is asked to confirm the save after clicking the save button
Filtering
Asset Comparison Table+ receives asset Master filters and Linked inputs. In vertical orientation, Asset Selection can use the Filter action to publish one selected canonical asset through configured Linked outputs. Filtering is unavailable as an output in horizontal orientation and remains separate from editing, asset-context, Quick Trend, ad-hoc, and hyperlink actions.
The filter indicator reports the effective asset count and lets the table clear a selection it published. See Filtering dashboards for setup and asset-to-event or event-to-asset examples.
Troubleshooting and limitations
- Check: If an asset is missing, check the search root, template, and asset filters.
- Check: Editing is available only for supported data sources and authorized users.



