



Vision Library+ / Charts and analytics
Event Analytics Table+
Event Analytics Table+ turns event frames into a table: one row per category, one column per summary, and a totals row. Count events, total a duration, compare it with a target, color the cells by limits, and let readers click a row to drill down or filter the rest of the display.
Overview
Event Analytics Table+ turns event frames into a table: one row per category, one column per summary, and a totals row. Count events, total a duration, compare it with a target, color the cells by limits, and let readers click a row to drill down or filter the rest of the display.

When to use it
Use Event Analytics Table+ when you need to:
- Count events or total a number from them by category, such as downtime events by cause.
- Show several summaries of the same events side by side, with a totals row.
- Compare a summary with a target and flag the rows that miss it.
- Keep the largest categories and group the rest as Others.
- Color cells by limits so readers spot the rows that need attention.
- Let readers click a row to drill into sub-categories or to filter other symbols.
Choose Event Analytics Pivot+ when you need categories across the top as well as down the side. Choose Event Analytics Chart+ when a picture reads better than numbers. Choose Events Table+ to list the individual events.
Before you begin
- Prepare an event frame template that has events in the time range you will display.
- To total or average a number, the event frames need a numeric or duration attribute. Text attributes can only be counted.
- Pick categories with a manageable number of distinct values, or use Top N.
- For click actions that change other symbols, add symbols that listen to filters. See Filtering dashboards.
Add and set up the symbol
- Select Event Analytics Table+ in the PI Vision symbol gallery.
- Drag an event frame attribute from the Event Frame Search results onto the display. The table starts with two columns: the attribute as a Dimension and a count of events as a Measure.
- Right-click the symbol, select Search Criteria..., choose the database and event frame template, and optionally set Asset Name to restrict the events to one asset, here
Line 1. Select Apply. A new symbol does not use the search of the Event Frame Search pane. - Right-click the symbol and select Configure Event Analytics Table.... Under Columns, select the Dimension in the list. Set Attribute to the attribute that defines the rows, for example |Reason|Level1, and enter the Title
Cause. - Select the Measure in the list. Set Attribute to Name and enter the Title
Events. Summary stays Count.
The table shows one row per cause with the number of events, and a Total row.

Note: Attribute names show a leading |. Hierarchical attributes such as |Reason|Level1 give one entry per level, and |Reason gives the full path, for example 02_Mechanical Failure|Breakdown.
Common tasks
Show several summaries side by side
Use this when readers need more than a count, for example the number of downtime events and how long they lasted.
- In the configuration pane, under Columns, select + Measure (1).
- Enter a Title (2), for example
Total downtime. - Set Attribute (3) to a numeric or duration attribute, here Duration.
- Set Summary (4) to Sum. Other choices are Count, Count Distinct, Min, Max, Average, Median, and StdDev.
- Repeat for a second measure, for example Duration with Average.
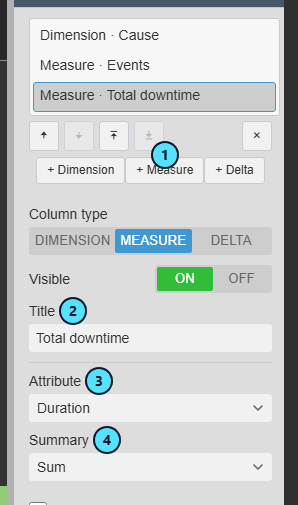
Each measure is a column. A duration shows as a readable time span. The Total row summarizes all events: it is the sum for Sum and the average over all events for Average, not the average of the rows.

Compare a summary with a target
Use this when readers should see at a glance which rows miss a target, for example downtime above 2 hours.
- In the configuration pane, under Columns, select + Delta.
- Enter a Title (1), for example
Against 2 h target. - Under Actual, set Attribute (2) to Duration and Summary to Sum.
- Under Target, set Mode (3) to Constant and enter the Target value (4) as a duration, such as
2h. Choose Measure instead to compare with a second attribute. - Under Delta, set Display value (5) to Absolute variation.
- Set Indication (6) to Less is good.
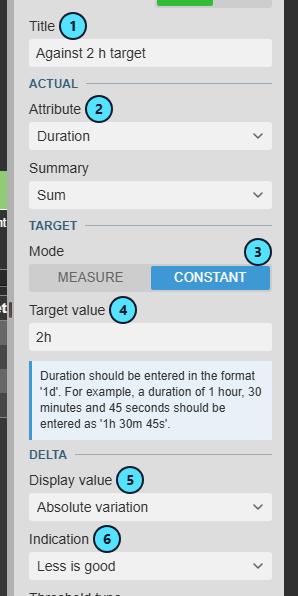
Rows above the target show a red up arrow with the excess, and rows below it a green down arrow. Threshold type and Threshold keep rows close to the target free of an indicator. With a Constant target the Total cell stays empty.

Keep only the largest groups
Use this when an attribute has more values than the table can show.
- In the configuration pane, under Columns, select the Dimension, here |Reason.
- Set Top N (1) to ON and Mode to Top.
- Enter the Count (2), for example
3. - Set Rank by (3) to the Measure that decides the ranking, here Events.
- Leave Others (4) ON to add one row that sums everything else.
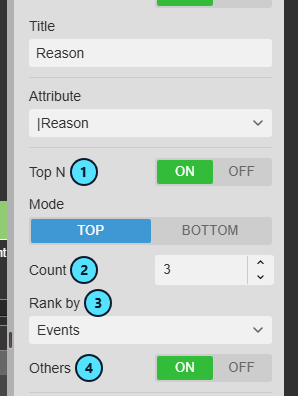
The table keeps the three largest rows and adds an Others row at the bottom. The Total row still covers every event. Use Bottom for the smallest rows.

Color cells by limits
Use this when readers must spot the rows that cross a limit without reading every number.
- Right-click the symbol and select Add Multi-State....
- Select the Measure in the list (1), here Total downtime, then select Enable multi-state (2).
- Under Property (3), choose how the color is drawn, for example Solid Fill. Select Gradient (4) to blend colors between limits.
- Choose the Error color (5). It colors values above the highest limit.
- Under Status, enter a limit (6) for each color. For a duration, type time spans such as
15mand1h.
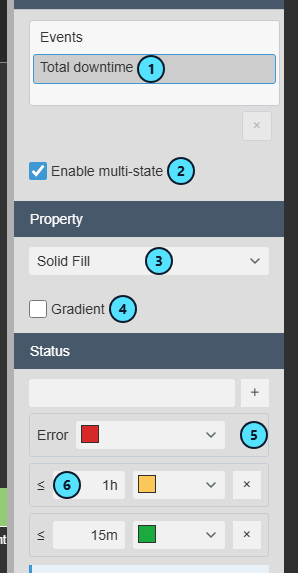
A cell takes the color of the lowest limit that is greater than or equal to its value. The Total row is never colored.

Drill down into a row
Use this when readers should click a row and see what is behind it, for example the impact of each cause.
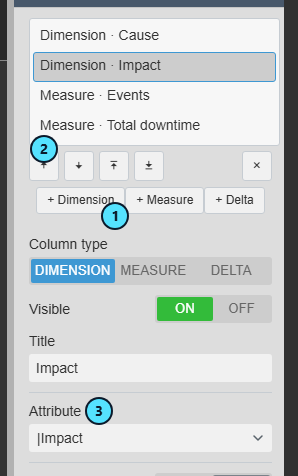
- In the configuration pane, under Columns, select + Dimension (1) and set Attribute (3) to the next level, here |Impact.
- Select Move up (2) until the new Dimension follows the first one. The order of the list is the order of the columns.
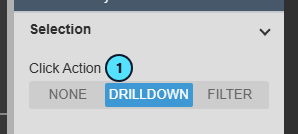
- Under Interactivity, open Selection and set Click Action (1) to Drilldown.
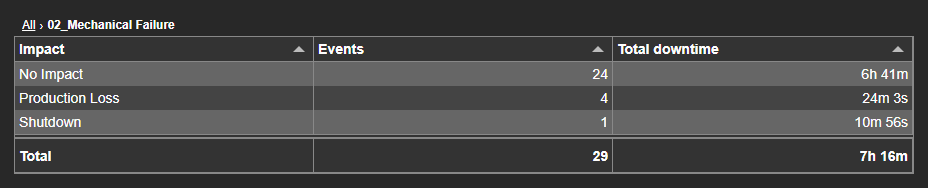
Click a row. The table shows the next Dimension for the events of that row, and a breadcrumb above the table names the path. Select All in the breadcrumb to go back.
Filter other symbols with a click
Use this when a click on a row should change the other symbols on the display. The other symbols must use the same events and listen to Master filters.
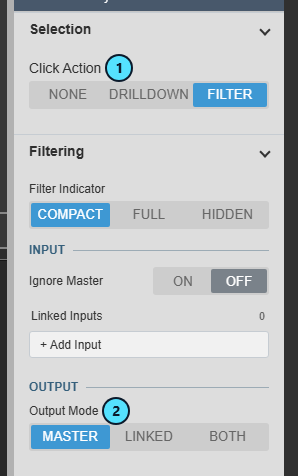
- Under Interactivity, open Selection and set Click Action (1) to Filter.
- Open Filtering and set Output Mode (2) to Master to filter every symbol that listens to Master filters. Linked and Both publish to named channels. See Filtering dashboards.
Click a row. The selected row turns bold and the other symbols recalculate for its events, here a chart with the same search. Click the same row again to clear the filter. The table keeps all its rows and shows a filter icon.
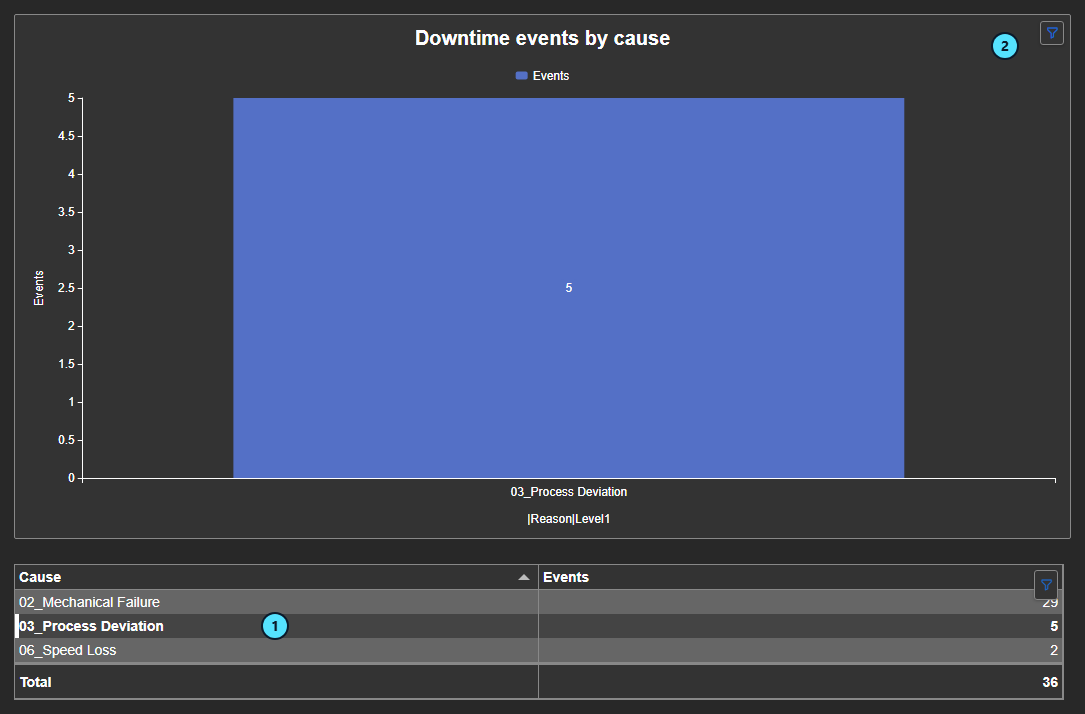
Use the symbol

| What it shows | |
|---|---|
| (1) | A column header. The title is the Title of the column, or the attribute and summary when the title is empty. |
| (2) | A row of the Dimension: one category. |
| (3) | A Measure cell: the summary of the events of that row. |
| (4) | A Measure cell colored by its limits. |
| (5) | A Delta cell with its value and the indicator arrow. The arrow always comes with a color. |
| (6) | The Total row, the summary over every event that the filters let through. |
- Sort: select a column header to sort the rows by that column. The sort lasts until the display is reloaded and is never saved with the display.
- Click a row to do what Click Action says: nothing, drill down, or publish a filter. A click never writes to the PI System. Clicking the Others row filters to all the values it combines.
- Filters: an Event Filter+ or another Master filter narrows the events and a filter icon appears. Ignore Master keeps the table unaffected.
- Time range: the table follows the display time range. With a Time Bar, the table has its own range.
- Empty values: a Delta with a missing target shows a dash for the percent display values, and a row without events for one side shows no value.
- No events: the table shows only its headers. Change the display time range or the search criteria.
- Export Data... in the right-click menu downloads the table, including the Total row.
Configure the symbol
Right-click the symbol and select Configure Event Analytics Table.... The right-click menu also offers Search Criteria..., Add Multi-State..., and Export Data.... The groups appear in this order.
Columns
One ordered list holds every column. Use + Dimension, + Measure, and + Delta to add one and the arrows to reorder or delete. A hidden column still counts: a hidden Dimension still groups the rows, and a hidden Measure can still rank and sort them. With no Dimension the table shows a single row over all events.
| Type | What it does |
|---|---|
| Dimension | Groups the events. The table has one row per combination of the Dimension columns. |
| Measure | One summary of the events in each row. |
| Delta | Compares an actual summary with a target in the same row. |
| Setting | What it does |
|---|---|
| Column type | Changes the type of the selected column. The settings of the old type are replaced by the defaults of the new one. |
| Visible | OFF hides the column from the table. |
| Title | The column header. Without one the table shows the attribute name. |
Columns > Dimension
| Setting | What it does |
|---|---|
| Attribute | The attribute that defines the rows. Used in Add and set up the symbol. |
| Group interval | Available for date and time attributes. Groups timestamps by year, month, day, hour, and other intervals. |
| Top N | Keeps the top or bottom rows. Mode, Count, Rank by (the Measure that ranks the rows), and Others set the details. Used in Keep only the largest groups. The Others row is always last. |
| Sort Order | Ascending or Descending. |
| Sort by | The Measure that orders the rows. |
With several Dimensions, Top N uses the first Dimension that has it on, and the sort follows the first Dimension.
Columns > Measure
| Setting | What it does |
|---|---|
| Attribute | The attribute to summarize. |
| Summary | Count, Count Distinct, Sum, Min, Max, Average, Median, or StdDev for numeric and duration attributes. Text attributes offer only Count and Count Distinct. Used in Show several summaries side by side. |
| Enable multi-state | Colors the cells by limits. Opens from Add Multi-State... and from the Measure. Used in Color cells by limits. |
Columns > Delta
A Delta computes its own actual and target in every row, so it does not depend on another column. Used in Compare a summary with a target.
| Setting | What it does |
|---|---|
| Actual | The Attribute and Summary of the actual value. |
| Target | Mode Measure uses a second attribute and summary. Constant uses a fixed Target value. For a duration, enter a time span such as 1h 30m. |
| Display value | What the cell shows: Actual value, Target value, Absolute variation (actual minus target), Percent variation, or Percent of target. |
| Indication | Greater is good or Less is good shows a green up or red down arrow by the sign of the difference. Warning if greater or Warning if less shows an amber warning. None shows no indicator. |
| Threshold type and Threshold | Available unless Indication is None. A difference within the threshold counts as on target and shows no indicator. Absolute is in the unit of the actual, Percent is a percentage of the target. |
In the Total row, a Delta with a Measure target compares the total actual with the total target. A Delta with a Constant target leaves its total cell empty.
Attributes
Lists the event frame attributes the table can use in Attribute lists. Drag more attributes onto the symbol to add them.
Interactivity
| Setting | What it does |
|---|---|
| Click Action | None, Drilldown, or Filter. Used in Drill down into a row and Filter other symbols with a click. With one Dimension there is nothing to drill into. |
| Filter Indicator | Compact shows a filter icon, Full adds the event count, and Hidden shows nothing. |
| Ignore Master | ON ignores Master filters on the display. Linked inputs still apply. |
| Linked Inputs | Maps a named channel from a publisher to a property of the events. See Filtering dashboards. |
| Output Mode | Available when Click Action is Filter. Master, Linked, or Both. |
Time Bar
Gives the table its own range with the shared Time Bar. Available when the search uses the display time range.
Table
| Setting | What it does |
|---|---|
| Show Totals | Adds the Total row. On by default. |
| Layout | Fit Table stretches the columns across the symbol, Fit Data sizes them to their content, and Manual gives every column the same Column Width in pixels. |
Style
The shared table style: a theme or custom colors and fonts, and the container style.
Export Data
| Setting | What it does |
|---|---|
| File Format | csv, xlsx, or pdf. Select Download to export the table with its Total row. Your administrator can hide this section. |
| PDF options | Available for pdf: style, title, orientation, font size, cell padding, and whether colors are printed. |
Troubleshooting and limitations
| Symptom | Cause | What to do |
|---|---|---|
| The table shows only its headers. | No events match the search in the display time range. | Open Search Criteria... and widen the search, or change the display time range. |
| A new symbol does not use the search you ran. | The symbol keeps its own search criteria. | Right-click the symbol, select Search Criteria..., and select Apply. |
| A row says No Data. | Those events have no value for the attribute. | Choose another attribute or accept the row. |
| Clicking a row does nothing. | Click Action is None, or there is no second Dimension to drill into. | Set Click Action under Interactivity > Selection. A drill-down needs a second Dimension. |
| After a filter click, other symbols are empty. | They search other events that do not have the clicked value. | Set Ignore Master to ON on those symbols, or point them at the same events. |
| Sum and Average are not offered. | The attribute is text. | Choose a numeric or duration attribute. |
| The Total cell of a Delta is empty. | The target is a Constant. | Use a Measure target to compare totals. |
| The table is long. | An attribute has many distinct values. | Use Top N with Others. |
Limitation: A header sort is not saved. Reloading the display returns to the configured order.
Limitation: A Delta target from another time period is not supported.


