Asset State Timeline+ for AVEVA PI Vision

PI Vision state timeline for every asset

See what every asset was doing and when. One row per AF asset, with continuous bars colored by digital state and the share of time spent in each state beside them.

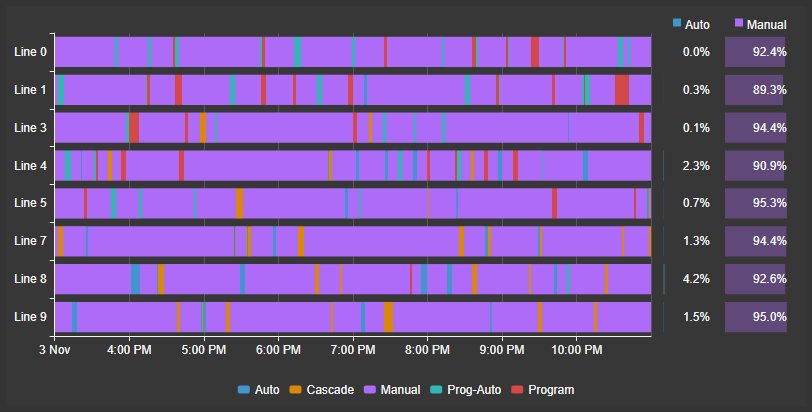
Asset State Timeline+ in PI Vision showing eight assembly lines as rows of continuous bars colored by mode, with the share of time in Auto and Manual beside each row and a legend of the states below
Asset State Timeline+ in Vision Library+ 2.2: one row per assembly line, colored by mode, with the share of time in Auto and Manual. Demo data. Select the image to enlarge.

Show asset operating states on one PI Vision time scale

See the operating mode, machine state or batch phase of many assets side by side, and decide which assets and colors the readers get.

One row per asset with colored state bars

Drag one digital, enumeration or Boolean attribute onto the display and every matching asset gets its own row on the same time scale.

  • Continuous bars show when each asset entered and left each state.
  • A legend names the states in the visible range; click an entry to hide or show a state.
  • Gaps show where an asset has no good data.
  • Add more attributes for one row per asset and attribute, up to 100 rows.
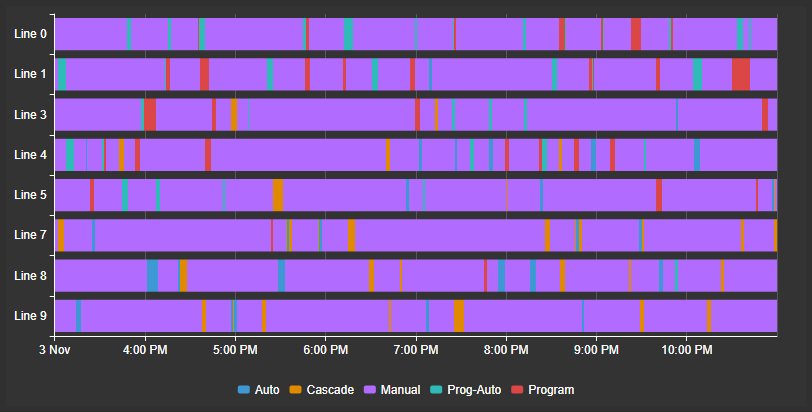
Asset State Timeline+ with eight assembly lines as rows of continuous state bars on one time axis and a legend naming the states Auto, Cascade, Manual, Prog-Auto and Program
One row per assembly line on one time scale. Demo data. Select the image to enlarge.

Assets from an asset search

Let a search decide which assets get a row, so the symbol follows your asset structure instead of a hand-made list.

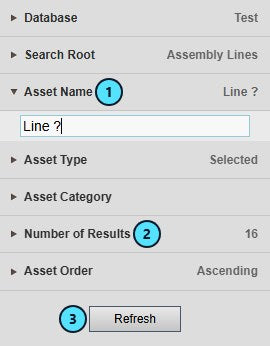
  • Search by asset name with wildcards, for example Line ?.
  • Narrow by search root, asset type and asset category.
  • Limit the number of results and sort them.
  • Refresh to update the rows.
Asset State Timeline+ Search Criteria settings with Database, Search Root, Asset Name set to Line ?, Asset Type, Asset Category, Number of Results, Asset Order and a Refresh button
Search Criteria choose the assets for the rows. Select the image to enlarge.

State colors your readers already know

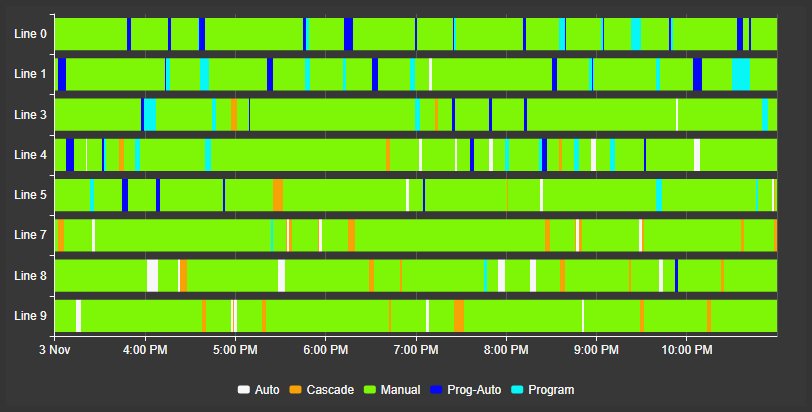
Give each state a fixed color with Multi-State, so Manual or Auto looks the same on every row and in every legend.

  • One color for each state, plus Bad Data.
  • The bars, the legend and the column headers use the same colors.
  • A state name keeps one color on every row.
  • Hide a state in the list to leave it out of the bars.
Asset State Timeline+ with eight assembly lines in custom state colors: green for Manual, white for Auto, orange for Cascade, blue for Prog-Auto and cyan for Program
The same rows in colors set per state. Demo data. Select the image to enlarge.

Share of time in each state per PI Vision asset

Add the number beside the bars: how long each asset ran in a state, and which assets matter right now.

% of Time in State columns

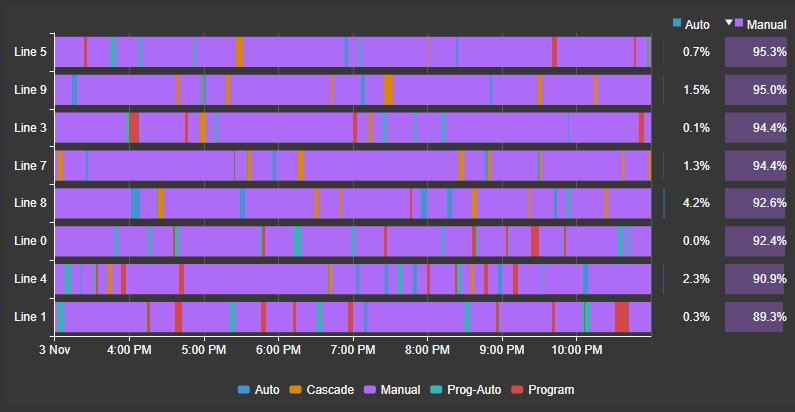
Turn on the states you care about and each one gets a column with its share of the visible time, sortable and with the times behind each figure.

  • One switch per state, for example Auto and Manual.
  • Figures follow the visible range, so a zoom updates them.
  • Time without good data does not count against a state.
  • Click a column header to sort the rows; hover a figure for the time in state and the time with good data.
Asset State Timeline+ with rows sorted by the share of time in Manual from highest to lowest, with columns for Auto and Manual beside the state bars
Rows sorted by time in Manual, highest first. Demo data. Select the image to enlarge.

Narrow the rows with Asset Filter+

Let operators choose assets by a value, such as the operating mode, and keep the timeline on the matching assets.

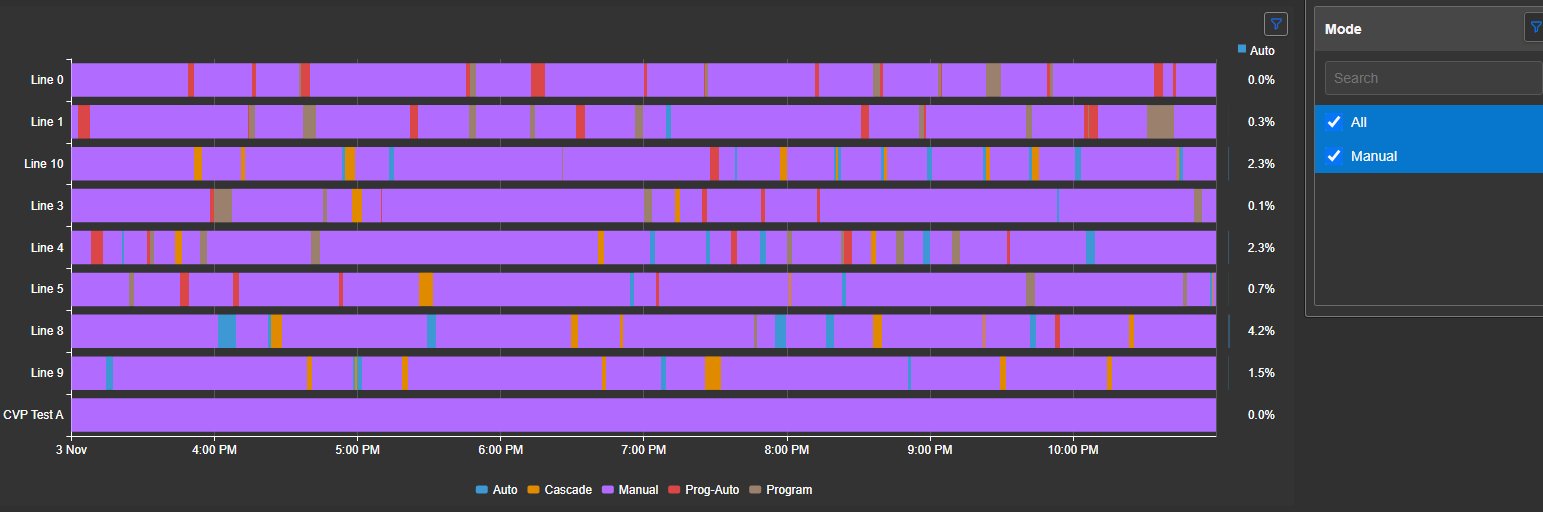
  • Place an Asset Filter+ on the display and list the attribute.
  • The symbol keeps the assets whose current value matches.
  • A filter indicator shows that the rows are narrowed.
  • A filter can only narrow the assets that the search finds.
Asset State Timeline+ with rows of assembly lines next to an Asset Filter+ panel for the Mode attribute with the value Manual selected
An Asset Filter+ on the Mode attribute narrows the assets of the timeline. Demo data. Select the image to enlarge.

Compare periods and open assets from the timeline

Line up state changes with a trend of the same period, and let a click on a row show that asset on the rest of the display.

Rulers shared with a trend

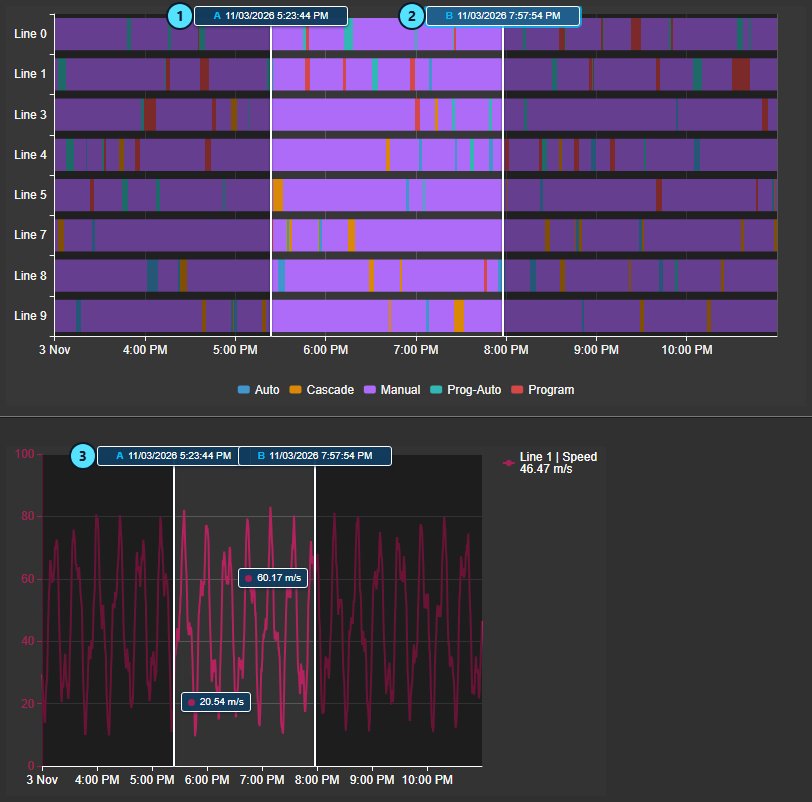
Place rulers A and B on the states and read what a trend did during the same period, such as what a line’s speed did while it ran in Auto.

  • Click the plot to place ruler A, then ruler B; drag a handle to move one.
  • A time-series chart such as Asset Time Series Chart+ on the display shows the same rulers.
  • Rulers placed on the other chart appear on the timeline too.
  • Hovering a chart shows a vertical line at the same time on the others.
Asset State Timeline+ with rulers A and B around a period of the state bars and the same period marked on a line speed trend below
Rulers A and B on the states and at the same times on a speed trend. Demo data. Select the image to enlarge.

Click a row to open its asset

Turn the timeline into a picker: a click on a row changes the asset of the display, or opens a detail display.

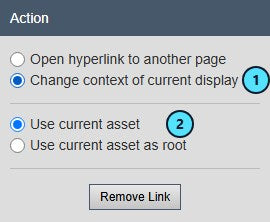
  • Change the asset context of the current display with a click on a row, its label or its figures.
  • Or open another page or display instead.
  • The timeline keeps its rows, so readers can choose the next asset.
  • Double-click a row for a popup trend of its attribute.
Asset State Timeline+ Add Navigation Link settings with Open hyperlink to another page and Change context of current display selected, plus Use current asset and Remove Link
A navigation link changes the asset context of the display. Select the image to enlarge.

Tooltips, zoom and image download

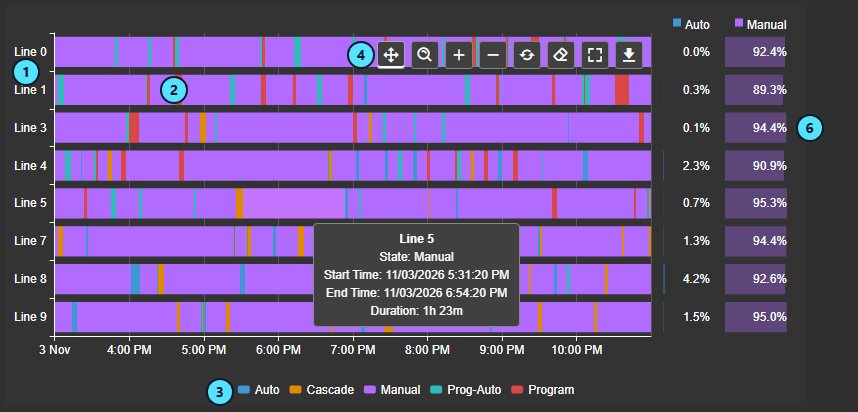
Hover a bar for its state, start, end and duration, and use the toolbar to look closer at a period or take the chart with you.

  • Mouse wheel, Zoom In, Zoom Out, Pan and Box zoom; the display time range follows.
  • Fullscreen for a larger view.
  • Download as PNG, SVG or PDF with the bars and the figures.
  • Optional Time Bar below the rows, with selectable durations.
Asset State Timeline+ with a tooltip on a Line 5 bar showing the state Manual, start time, end time and duration, a toolbar above the rows and a legend of states below
Tooltip and toolbar. Demo data. Select the image to enlarge.

PI Vision asset state examples

Four common ways teams use Asset State Timeline+ on their displays.

Operating mode across lines

Data
A Mode attribute of every assembly line from one AF template
Settings
AF search on the line name, Multi-State colors, legend
Shows
Which lines ran in Auto, Manual or Cascade, and when they changed

Time in Manual per shift

Data
The same mode attribute over the shift
Settings
% of Time in State for Manual, rows sorted by it
Shows
Which lines spent the most time in Manual

Speed during a state

Data
Mode bars next to a speed trend
Settings
Rulers A and B shared with Asset Time Series Chart+
Shows
What the speed did while a line ran in Auto

Pick an asset from the overview

Data
Mode of every unit and an Asset Filter+
Settings
Filter on Manual, navigation link on each row
Shows
The units in Manual, opened on a detail display with one click

Asset State Timeline+ FAQ

Questions we are asked most often. Read the Asset State Timeline+ documentation or ask a technical question.

How is it different from a trend or Asset Time Series Chart+?

A trend draws numeric values as lines. Asset State Timeline+ draws digital, enumeration and Boolean states as continuous colored bars, one row per asset, and can show the share of time in each state. Use Asset Time Series Chart+ for numeric values across assets and Event Gantt Chart+ when the bars come from event frames.

Which attributes can it show?

Attributes with digital, enumeration or Boolean history on AF assets, usually from one element template. It reads recorded values and does not show string attributes or PI Points without AF.

How many assets can one timeline show?

Up to 100 rows, one for each asset and attribute. A search can limit the number of results and sort them.

Can it show how long an asset spent in a state?

Yes. Switch on a state under % of Time in State and it gets a column with its share of the visible time with good data. The columns are sortable, and a hover shows the time in the state and the time with good data.

What do we need to run it?

Vision Library+ 2.2 on PI Vision 2021 or later with PI Web API, and PI AF Server 2018 SP2 or later. Asset State Timeline+ uses AF assets and attributes, runs in PI Vision and reads data with each user’s existing PI permissions. It does not write data to the PI System.

How do we get Asset State Timeline+?

Asset State Timeline+ is new in Vision Library+ 2.2 and part of Vision Library+, together with the other Vision Library+ symbols. Request a trial to test it in your own PI Vision environment.

Try Asset State Timeline+ in your PI Vision

Asset State Timeline+ is included in Vision Library+, the PI Vision custom symbol library from Software Athlete. Test it on your own displays and data.