Control Chart+ for AVEVA PI Vision

SPC chart for PI Vision with rules and Cpk/Ppk built in

Looking for an SPC or SQC chart in PI Vision? Control Chart+ brings SPC and SQC control charts to your displays and replaces ProcessBook SQC charts. It plots a measured value against control limits, marks the points that break a rule and shows a status badge, with Cpk and Ppk when you add specification limits.

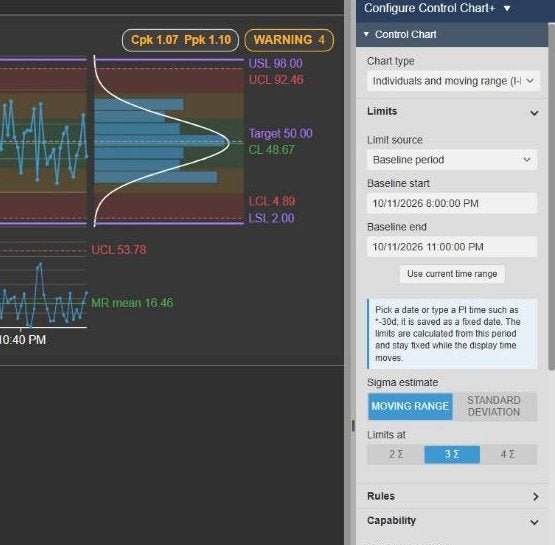
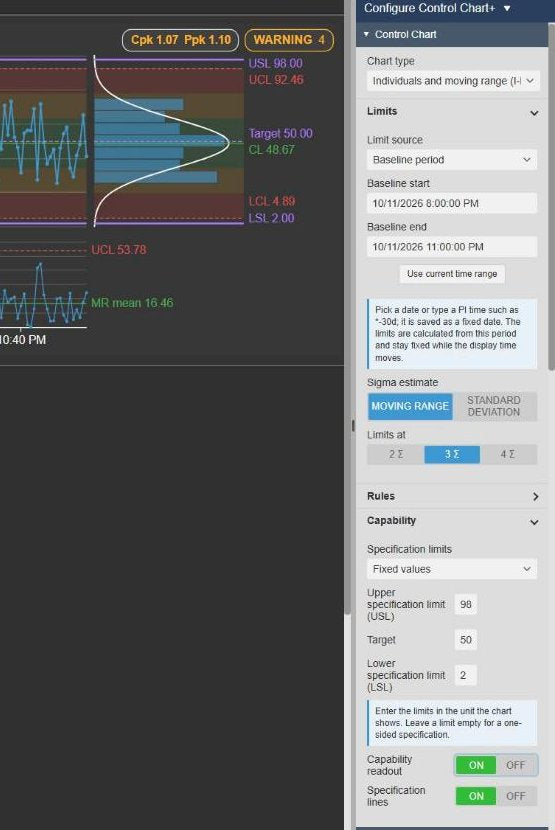
SPC chart in PI Vision: Control Chart+ with an individuals chart, a histogram with normal curve and a moving range chart, a Cpk and Ppk badge with a warning status, and specification and control limits, next to the Limits and Capability settings
Control Chart+ in PI Vision: individuals chart, histogram and moving range chart with Cpk and Ppk. Demo data. Select the image to enlarge.

Replace ProcessBook SQC charts in PI Vision

PI Vision has no built-in SPC or SQC chart symbol and no equivalent of the ProcessBook SQC chart. Control Chart+ adds SPC and SQC control charts to PI Vision displays, so you can rebuild your ProcessBook SQC charts when you migrate.

ProcessBook SQC settings and their Control Chart+ equivalents

The common ProcessBook SQC setups have a matching setting in Control Chart+.

  • Individuals chart with a moving range chart: I-MR, the default chart type.
  • Western Electric rules: choose the Western Electric rule set.
  • Limits stored in the PI System: limit source AF limit traits or limit data sources.
  • Limits from a reference period: limit source baseline period.
  • Cp and Cpk: add specification limits to see Cpk and Ppk.
  • X-bar and R, X-bar and S: the X-bar-R and X-bar-S chart types.
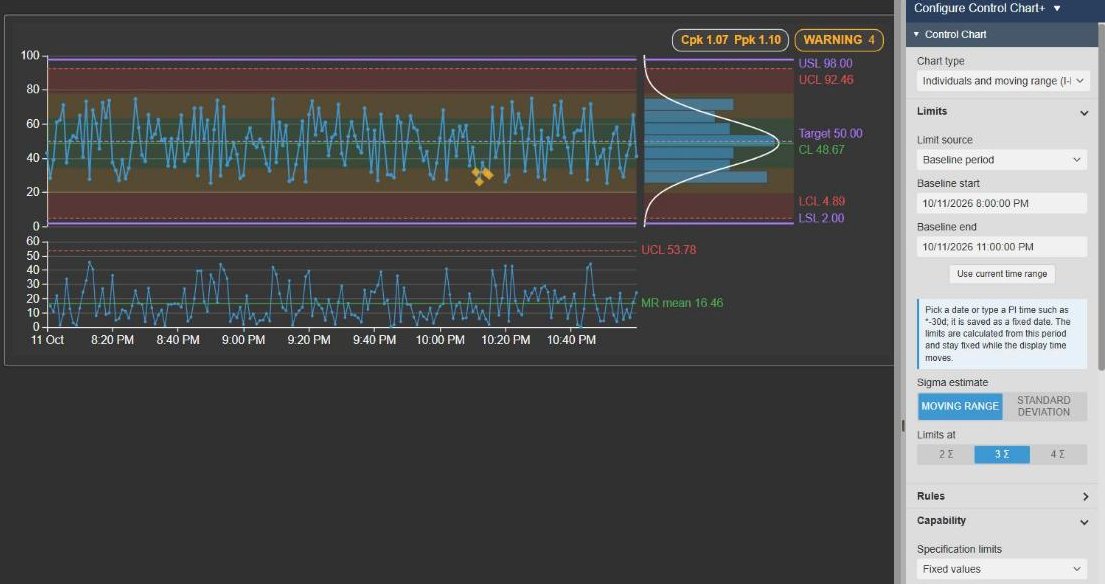
SQC chart for PI Vision: Control Chart+ with an individuals chart, histogram, moving range chart and Cpk and Ppk badge next to the Limits and Capability settings
An SQC-style control chart in PI Vision. Demo data. Select the image to enlarge.

SPC control chart with limits and rules in PI Vision

Choose the chart type, where the control limits come from and which rules flag a point.

Individuals (I-MR) and X-bar SPC charts

Plot single values, or the mean of each subgroup when data arrives fast, and see the spread on a second chart below.

  • Individuals and moving range (I-MR) by default.
  • X-bar-R and X-bar-S, with one subgroup per interval.
  • A moving range, range or standard deviation chart on the same time axis.
  • A histogram with a normal curve next to the chart.
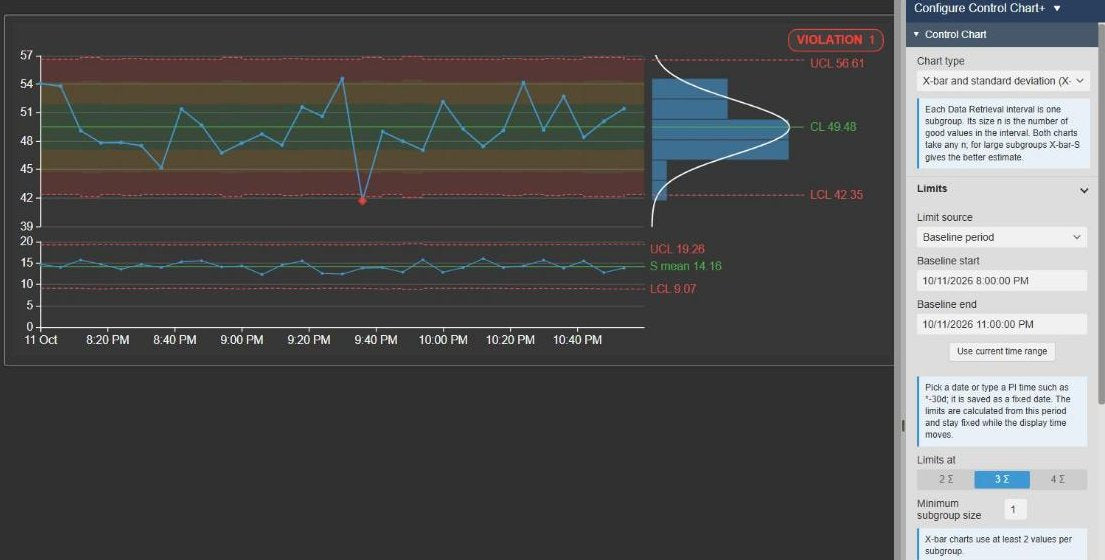
SPC X-bar chart in PI Vision: Control Chart+ as an X-bar and standard deviation chart with subgroup means, a rule violation marker and the S chart below, next to the chart type and limit settings
X-bar-S chart with a rule violation, next to the chart type setting. Demo data. Select the image to enlarge.

Control limits from a baseline, AF limits or other sources

Calculate the limits from a period when the process was normal, so they stay fixed while the display time moves.

  • Limit source: baseline period, AF limit traits, limit data sources or the visible window.
  • Baseline start and end, or one click to use the current time range.
  • Limits at 2, 3 or 4 sigma, estimated from the moving range or the standard deviation.
  • A minimum subgroup size for X-bar charts.
Control Chart+ Limits settings with the limit source Baseline period, a baseline start and end time, the sigma estimate Moving range and limits at 3 sigma
Baseline limit settings. Demo data. Select the image to enlarge.

Nelson, Western Electric or custom rules

Flag more than points beyond the limits: runs, trends and shifts that show the process moving before it leaves its limits.

  • All eight Nelson rules by default, or the Western Electric set.
  • A custom set: switch each rule on or off and set its run length.
  • Points beyond the control limits in red, other rule patterns in orange.
  • Rules are checked while the display is open; the chart sends no alerts.
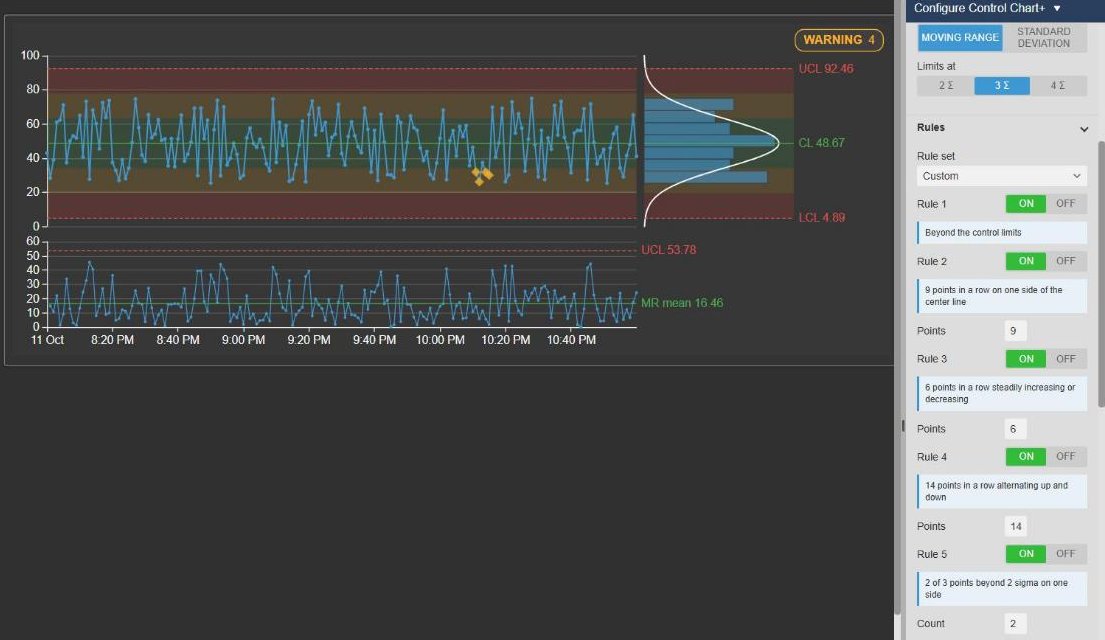
SQC rules in PI Vision: Control Chart+ with the Rules settings open: the Custom rule set with switches and run lengths for rules 1 to 6, next to the chart
A custom rule set with a switch and a run length per rule. Demo data. Select the image to enlarge.

SPC process stability and Cpk/Ppk capability in PI Vision

See at a glance whether the process is stable, which rules fired and how capable it is against its specification.

Status badge and rule markers

A status badge counts the points that broke a rule, and hovering a point names the rules it broke.

  • Status badge with the number of rule-breaking points: warning or violation.
  • Red markers for points beyond the limits, orange for other rule patterns.
  • Hover tooltip with time, value, limits and every rule the point broke.
  • Sigma zones and UCL, CL and LCL labels with their values.
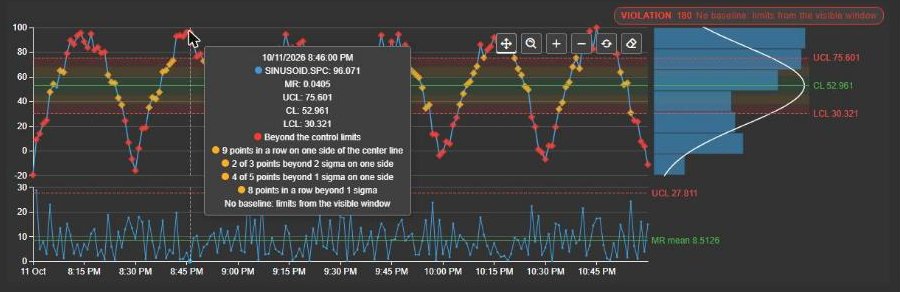
Control Chart+ with a violation badge, red and orange rule markers, and a hover tooltip listing the value, the control limits and the rules the point broke, with the chart toolbar visible
A hovered point with the rules it broke. Demo data. Select the image to enlarge.

Cpk and Ppk against specification limits

Add the specification limits and see how capable the process is, not only whether it is stable.

  • Specification limits as fixed values, from AF limit traits or from limit data sources.
  • A Cpk and Ppk badge on the chart, with USL, target and LSL lines.
  • One-sided specifications by leaving a limit empty.
  • Capability readout and specification lines can each be switched off.
Control Chart+ with a Cpk and Ppk badge and USL, target and LSL lines, next to the Capability settings with fixed specification limits
Cpk and Ppk with fixed specification limits. Demo data. Select the image to enlarge.

Histogram and moving range chart

Compare the shape of the distribution with the normal curve, and watch the point-to-point variation on its own chart.

  • Histogram on the same value scale, with a normal curve.
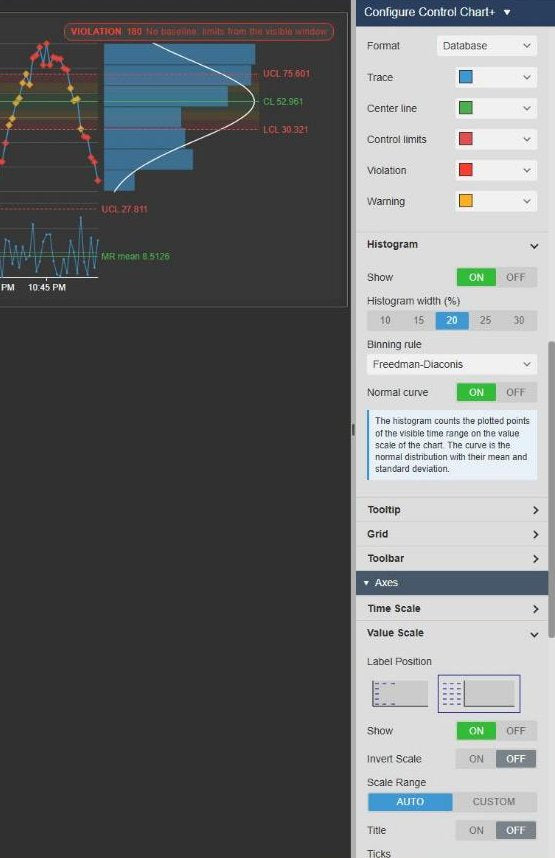
  • Histogram width and binning rule (Freedman-Diaconis, Sturges, Scott or manual).
  • Moving range, range or standard deviation chart that can be switched off.
Control Chart+ Histogram settings with show, histogram width, binning rule and normal curve, next to the chart
Histogram settings. Demo data. Select the image to enlarge.

Control chart zoom, rulers and display options

Explore the data, take measurements and match the chart to your display.

Zoom, pan and rulers

Zoom into a period, move along the time axis and measure between two points.

  • Toolbar with pan, box zoom, zoom in and out, reset and clear rulers.
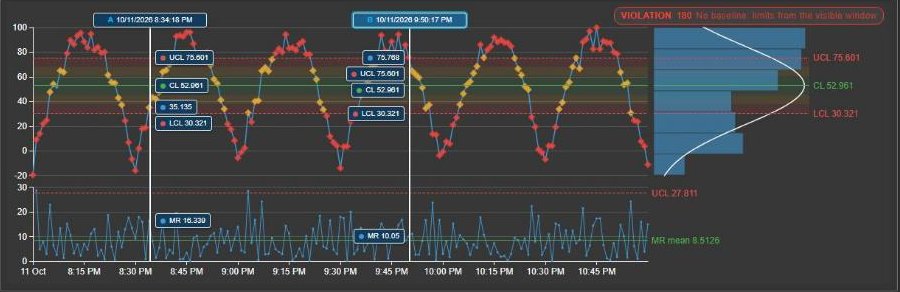
  • Click twice to place rulers A and B with the values at each position.
  • Hover and rulers on both charts, with the values at each position.
Control Chart+ with rulers A and B placed on the chart, each showing the control limits, the center line and the value at its position, on both charts
Rulers A and B with the values at each position. Demo data. Select the image to enlarge.

Display options and colors

Show only what the audience needs and use your own colors for the trace, limits, violations and warnings.

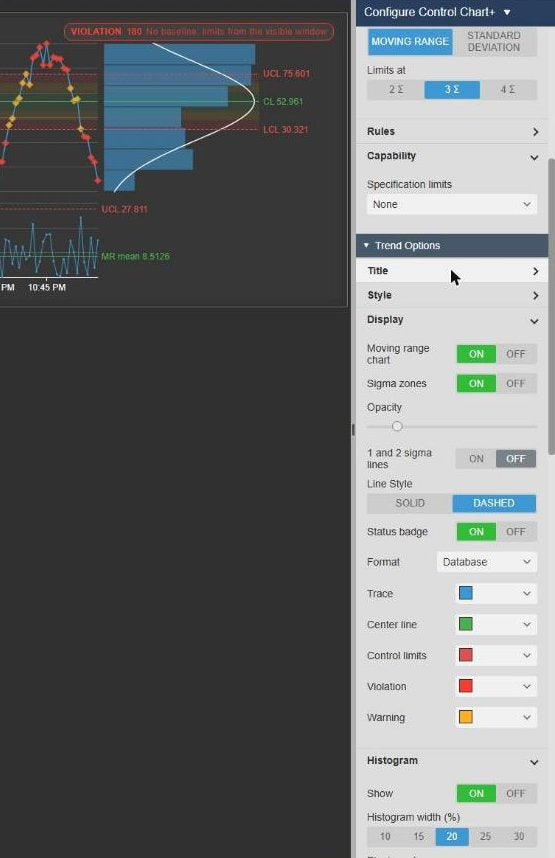
  • Moving range chart, sigma zones, status badge and one and two sigma lines on or off.
  • Zone opacity and solid or dashed limit lines.
  • Colors for the trace, center line, control limits, violations and warnings.
Control Chart+ Display settings with the moving range chart, sigma zones, opacity, line style, status badge and color options
Display settings. Demo data. Select the image to enlarge.

Data retrieval and intervals

The chart loads its own history from the measured value, so you control how many samples it plots.

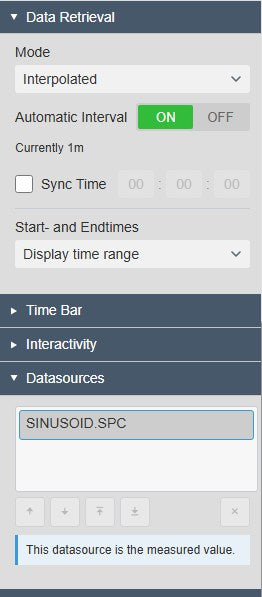
  • Interpolated, recorded or interval average retrieval.
  • Automatic interval, or your own interval to match a shift or batch.
  • Optional sync time for a fixed interval grid.
  • One measured value, loaded directly from PI.
Control Chart+ Data Retrieval settings with the mode Interpolated, the automatic interval, sync time, the time range and the measured-value data source
Data retrieval settings and the measured value. Select the image to enlarge.

PI Vision SPC and SQC chart examples

Four common ways teams use Control Chart+ on their displays.

Fill weight or dosing

Data
The weight or dose of each filled unit
Settings
I-MR chart, limits from a baseline period, Western Electric rules, specification limits from the product spec
Shows
Whether filling stays centered and capable

Batch quality value

Data
A lab or analyzer result per batch or shift
Settings
X-bar-S chart with an interval that matches the shift, baseline from a known-good period
Shows
Whether batch averages and spread stay stable

Process shift after a change

Data
A key temperature or pressure before and after a change
Settings
Baseline from the period before the change, all eight Nelson rules, hover to see which rules fired
Shows
Whether the change moved the process

Stored limits from a quality model

Data
A measured attribute that already has limits in AF
Settings
Limit source AF limit traits, specification limits from AF
Shows
Control limits that follow the plant model

Watch the SPC chart for PI Vision in action

A captioned tour of Control Chart+ on a PI Vision display: control limits, histogram, status badge, rulers, limit sources, rule sets, X-bar-S charts and Cpk and Ppk.

Control Chart+ product demo. Demo data.

Control Chart+ FAQ

Questions we are asked most often. Read the Control Chart+ documentation or ask a technical question.

Does PI Vision have an SPC or SQC chart?

PI Vision has no built-in SPC or SQC chart symbol, and no equivalent of the ProcessBook SQC chart. Control Chart+ adds one: an SPC control chart with I-MR or X-bar charts, Nelson or Western Electric rules, control limits from a baseline or AF, and Cpk and Ppk.

Can I replace our ProcessBook SQC charts?

Yes, you can rebuild them as Control Chart+ symbols. The documentation maps the common ProcessBook SQC settings to their equivalents: individuals and moving range charts, Western Electric rules, limits stored in the PI System (AF limit traits) or taken from a reference period (baseline), X-bar-R and X-bar-S charts, and Cpk with specification limits.

What is the difference between control limits and specification limits?

Control limits describe how the process actually behaves and are calculated from its own data. Specification limits describe what the customer or the product requires. A stable process can still be outside its specification, which is why Control Chart+ shows Cpk and Ppk when you add specification limits.

Should I use I-MR or an X-bar chart?

Use I-MR when you plot single values, for example one reading per interval. Use X-bar-R or X-bar-S when data arrives fast and you want the mean and the spread of each subgroup. For larger subgroups X-bar-S gives the better estimate.

Does Control Chart+ send alerts when a rule is broken?

No. Control Chart+ checks the rules while a display that contains it is open, marks the points and shows the status badge. It does not send notifications or write anything to the PI System.

What do we need to run it?

PI Vision 2021 or later with PI Web API, and PI AF Server 2018 SP2 or later. Control Chart+ runs in PI Vision and uses each user’s existing PI permissions. Stored AF limit traits need the measured value to be an AF attribute.

How do we get Control Chart+?

Control Chart+ is part of Vision Library+, together with the other Vision Library+ symbols. Request a trial to test it in your own PI Vision environment.

Try Control Chart+ in your PI Vision

Control Chart+ is included in Vision Library+, the PI Vision custom symbol library from Software Athlete. Test it on your own displays and data.