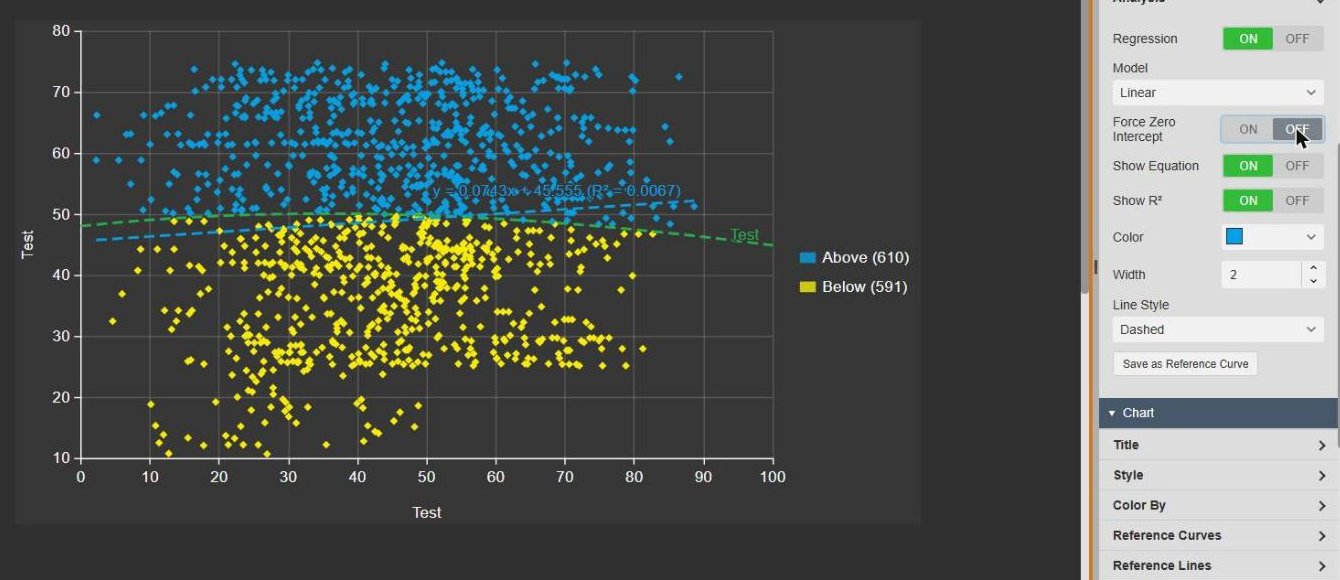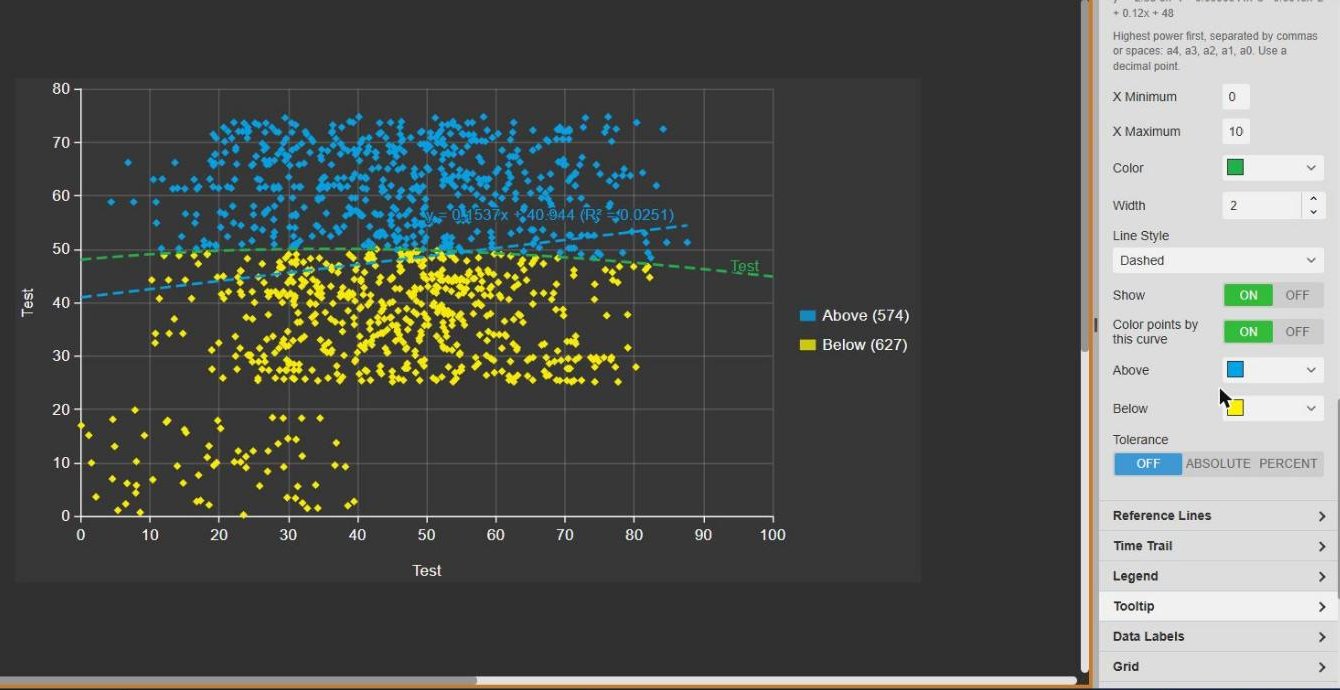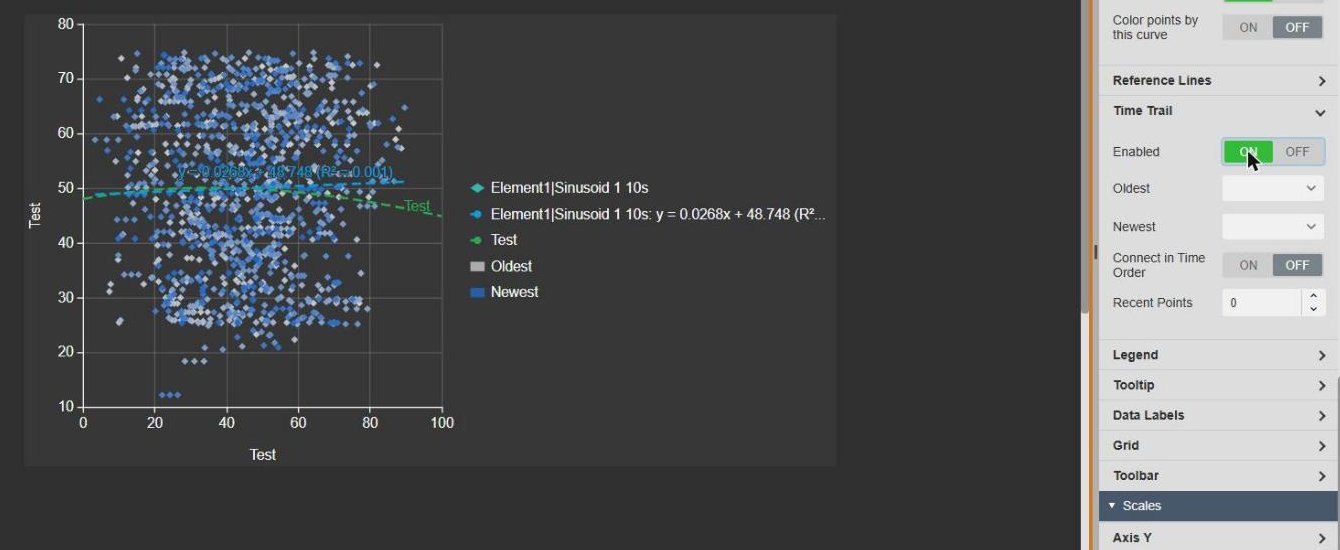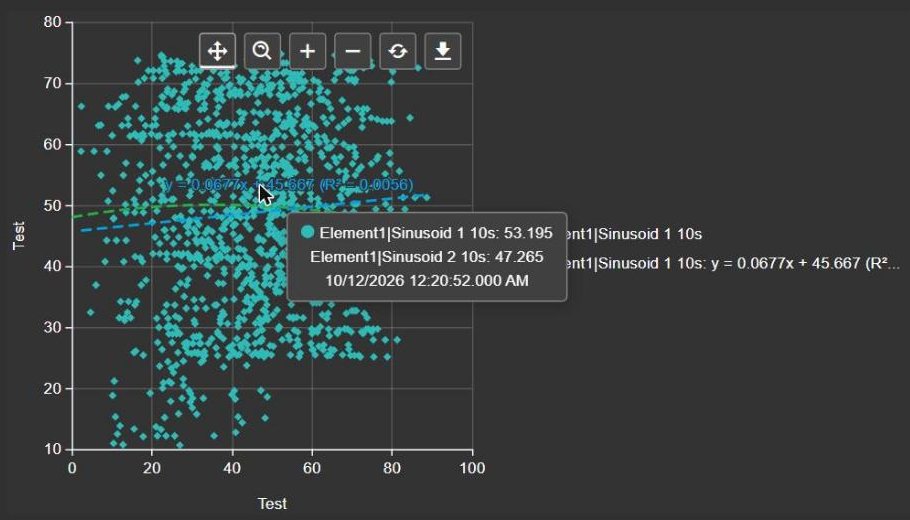
Regression line with equation and R²
Fit a line through the plotted points and read the equation and R² on the chart.
- Regression on or off for each Y value.
- A choice of regression model, linear by default.
- Optional zero intercept, so the line passes through the origin.
- Equation and R² shown on the chart, with your own color, width and line style.
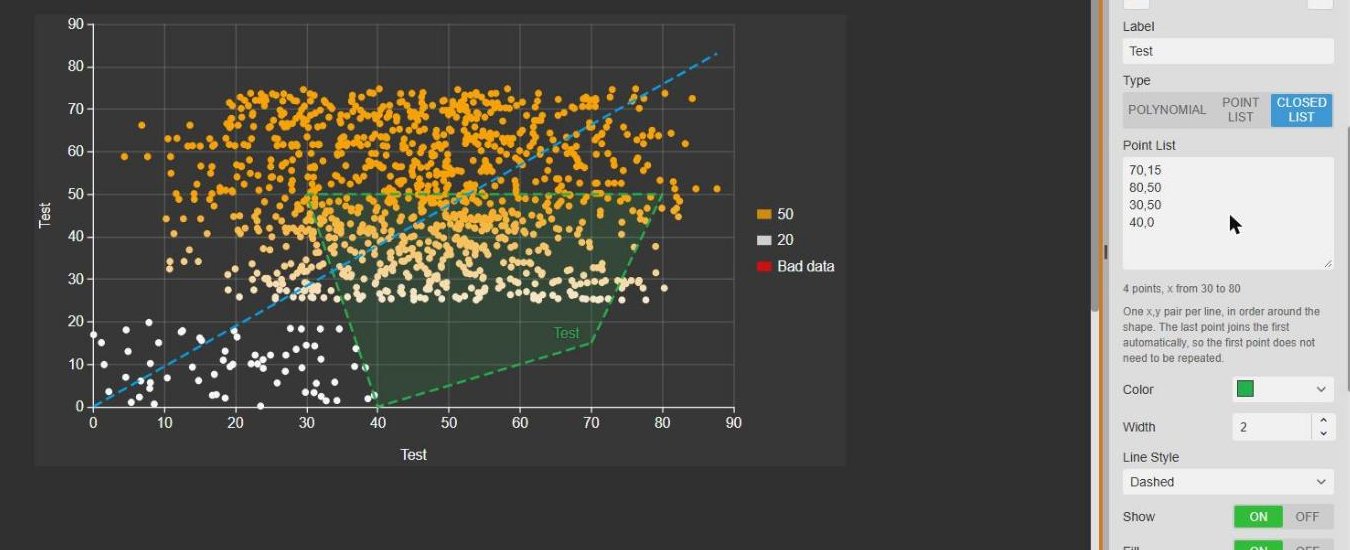
- Save the fit as a reference curve.