Waterfall Chart+ for AVEVA PI Vision

PI Vision waterfall chart for losses, gains and balances

See how a starting value becomes the result, step by step. Waterfall Chart+ draws totals and the gains and losses between them as floating bars in your PI Vision display.

Waterfall Chart+ in PI Vision showing an OEE loss breakdown from total time through planned downtime, station failure, changeover, small stops and reduced speed to net operating time, with total bars for the checkpoints and red bars for the losses, next to the Trace Options with Total switched on for Operating Time
Waterfall Chart+ v2.0 in PI Vision: an OEE loss breakdown with checkpoint totals, next to the Trace Options. Demo data. Select the image to enlarge.

PI Vision waterfall chart for totals, gains and losses

Each data source becomes one bar: either an absolute total, or a change that moves the running total up or down.

Start, end and checkpoint totals

Mark the starting value, the result and any stage in between as totals, so the chart shows where the value stands after each group of changes.

  • One bar per PI point or AF attribute, in the order of the data source list.
  • The first bar is always a total; switch Total on for any other checkpoint.
  • Total bars show the absolute value and start from zero.
  • Reorder the steps with Up, Down, Move to Top and Move to Bottom.
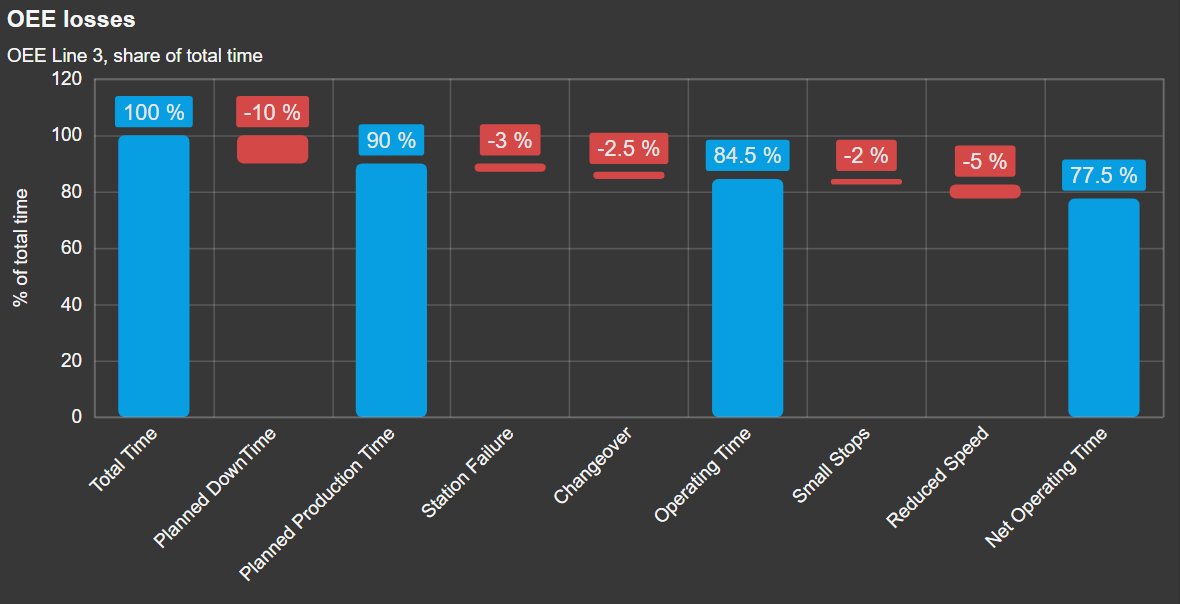
Waterfall Chart+ in the PI Vision theme with total time at 100 percent, planned production time at 90, operating time at 84.5 and net operating time at 77.5 percent as blue total bars, and the losses between them as floating red bars, each labelled with its value
Total time, three checkpoint totals and the losses between them, with a value axis title. Demo data. Select the image to enlarge.

Gains and losses as floating bars

Relative bars float from the running total, up for a gain and down for a loss, so the largest contributors stand out at once.

  • Positive values add to the running total, negative values subtract from it.
  • Invert flips the sign of a loss that is stored as a positive number.
  • Value type per data source: the value, or its average, minimum, maximum, range or standard deviation over the display time range.
  • Values are shown as provided; differences between data sources are calculated upstream, for example in AF.
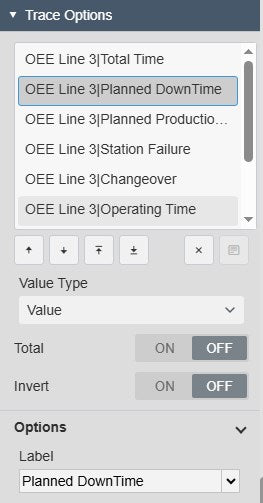
Waterfall Chart+ Trace Options with the list of OEE data sources, Planned DownTime selected, the value type Value, Total switched off and the Invert switch, and the label Planned DownTime
Trace Options for one loss: value type, Total, Invert and label. Select the image to enlarge.

Waterfall chart labels and colours

Put the exact numbers on the bars and colour them the way your team reads gains and losses.

Data labels with values and units

Read every step without hovering: each bar carries its value with units, and optionally its name.

  • Labels outside the bar, inside it, or inside at its top or bottom.
  • Value, name and units from the data source, with an optional background and font size.
  • One number format for labels, tooltip and value axis.
  • Hover tooltip with name and value, and a pointer line or crosshair.
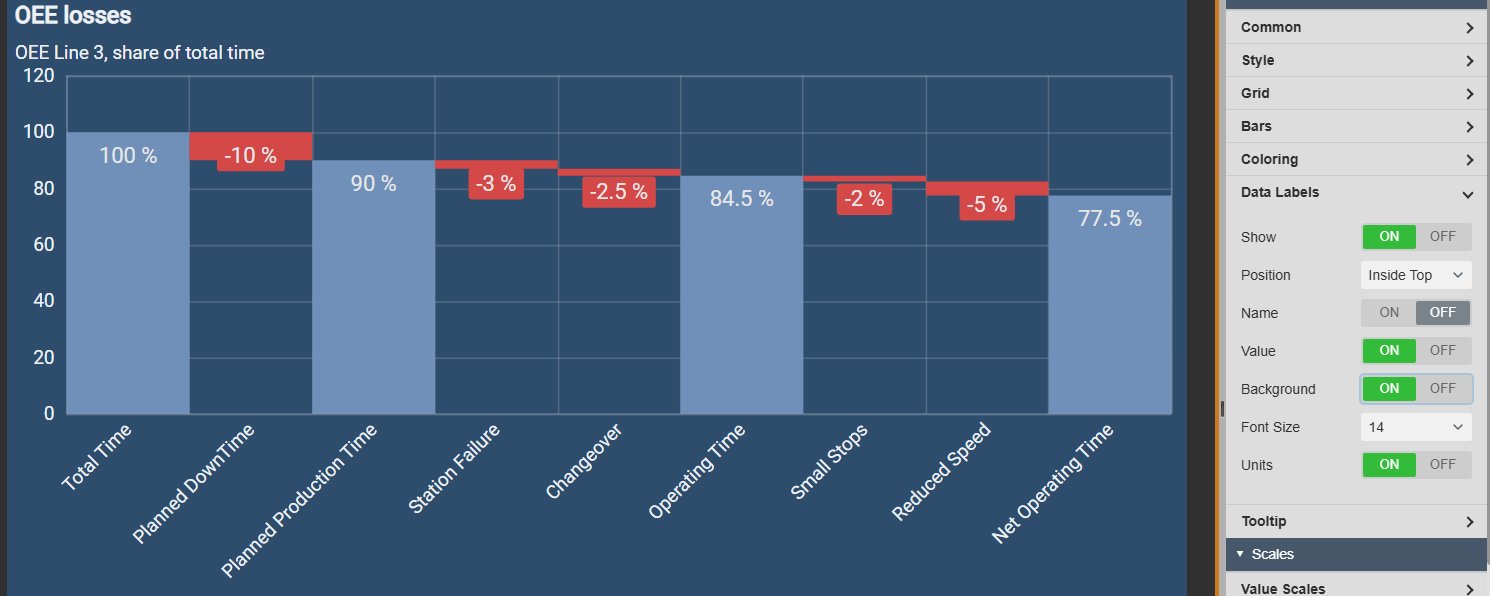
Waterfall Chart+ with the values of the total bars written inside the top of each bar and the losses on red badges below their bars, next to the Data Labels settings with position Inside Top, value, background and units on and font size 14
Data labels inside the top of each bar, next to the Data Labels settings. Demo data. Select the image to enlarge.

Colours for totals, increases and decreases

Use one colour each for totals, increases and decreases, or give every step its own colour.

  • Default mode with a total, a positive and a negative colour.
  • Custom mode with a colour per data source, for example one per loss category.
  • Bar width from 10 to 100 per cent.
  • Rounded corners from a border-radius slider.
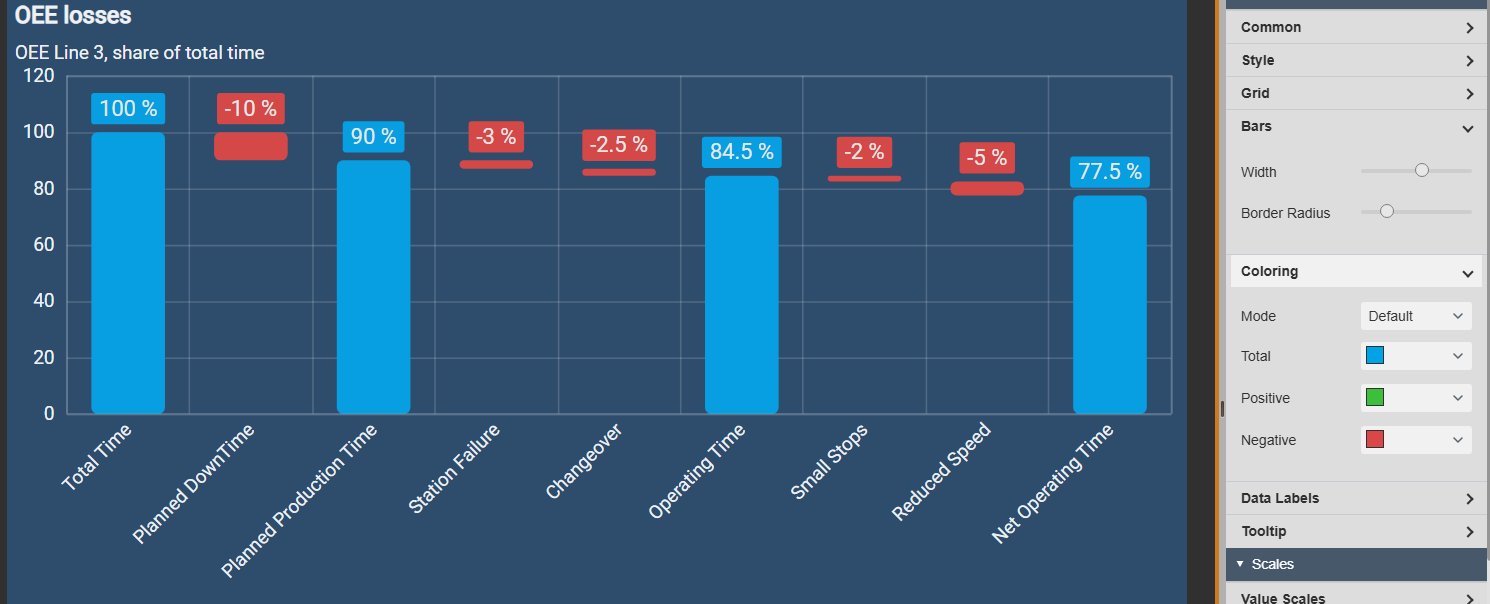
Waterfall Chart+ with light blue rounded total bars and red rounded loss bars at 60 percent width, next to the Bars settings with width and border radius sliders and the Coloring settings in Default mode with total, positive and negative colours
Rounded bars with a light blue total colour, next to the Bars and Coloring settings. Demo data. Select the image to enlarge.

Waterfall chart layout, scales and themes

Fit the chart to the space on the display and to the look of the rest of the dashboard.

Vertical columns or horizontal bars

Turn the chart on its side when the step names are long, such as loss categories, or when the display has more height than width.

  • Vertical or horizontal orientation; labels, axes and grid follow.
  • Value scale with position, invert, an automatic, database or custom range, title and ticks.
  • Category axis with position, invert and title, for example to list the steps from the top down.
  • Grid lines, bands and an axis or frame border.
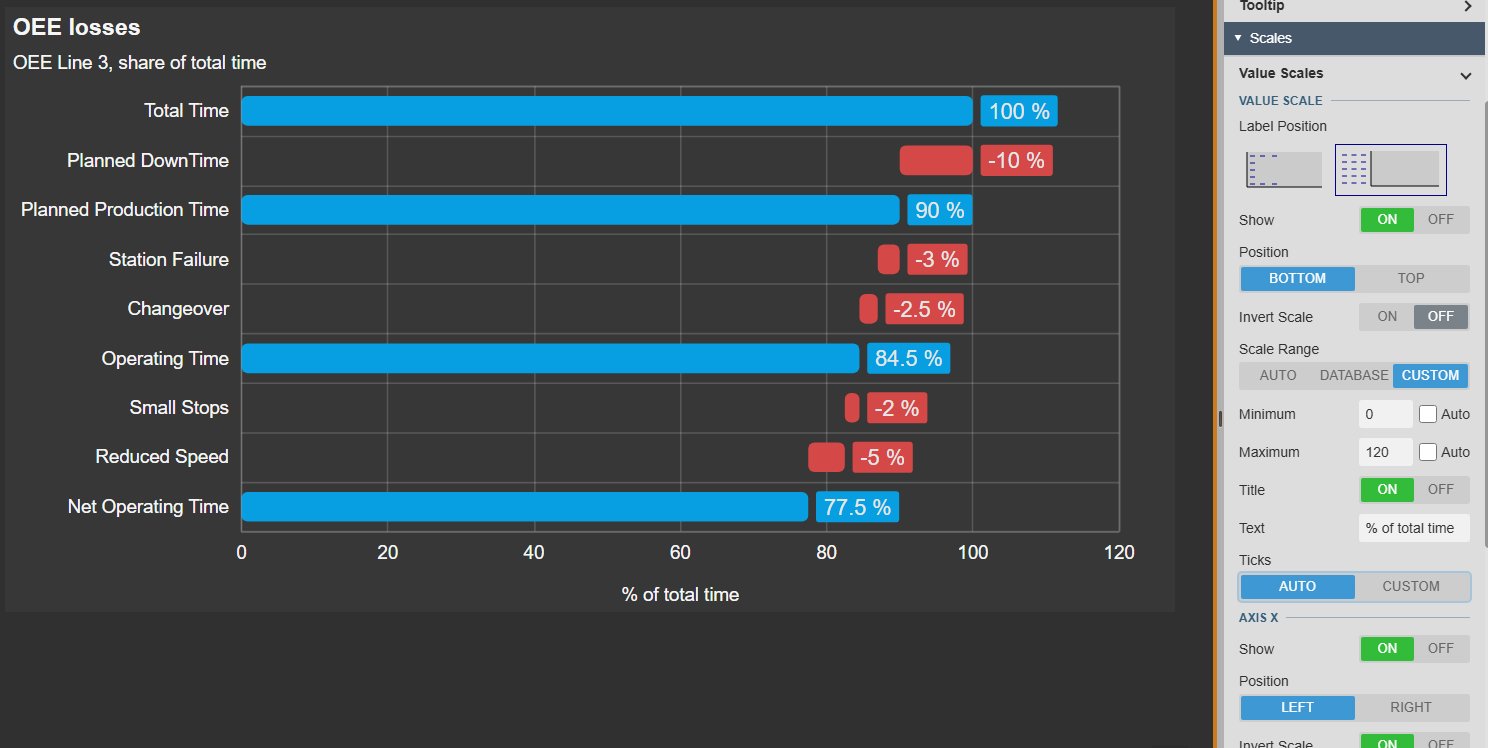
Waterfall Chart+ in horizontal orientation listing total time at the top down to net operating time, with blue total bars, red loss bars and the axis title percent of total time, next to the Value Scales settings with a custom range from 0 to 120, a title and the inverted category axis
Horizontal orientation with the steps listed from the top down, next to the scale settings. Demo data. Select the image to enlarge.

Themes, containers and titles

Match the chart to the display with a built-in theme, or set the colours yourself.

  • Nine built-in themes, including Light, Print and High Contrast, plus custom colours.
  • Flat or gradient surface, and a None, Flat, Card, Framed or Glass container.
  • Apply the style to every Vision Library+ symbol on the display in one step.
  • Title and subtitle with alignment and font size.
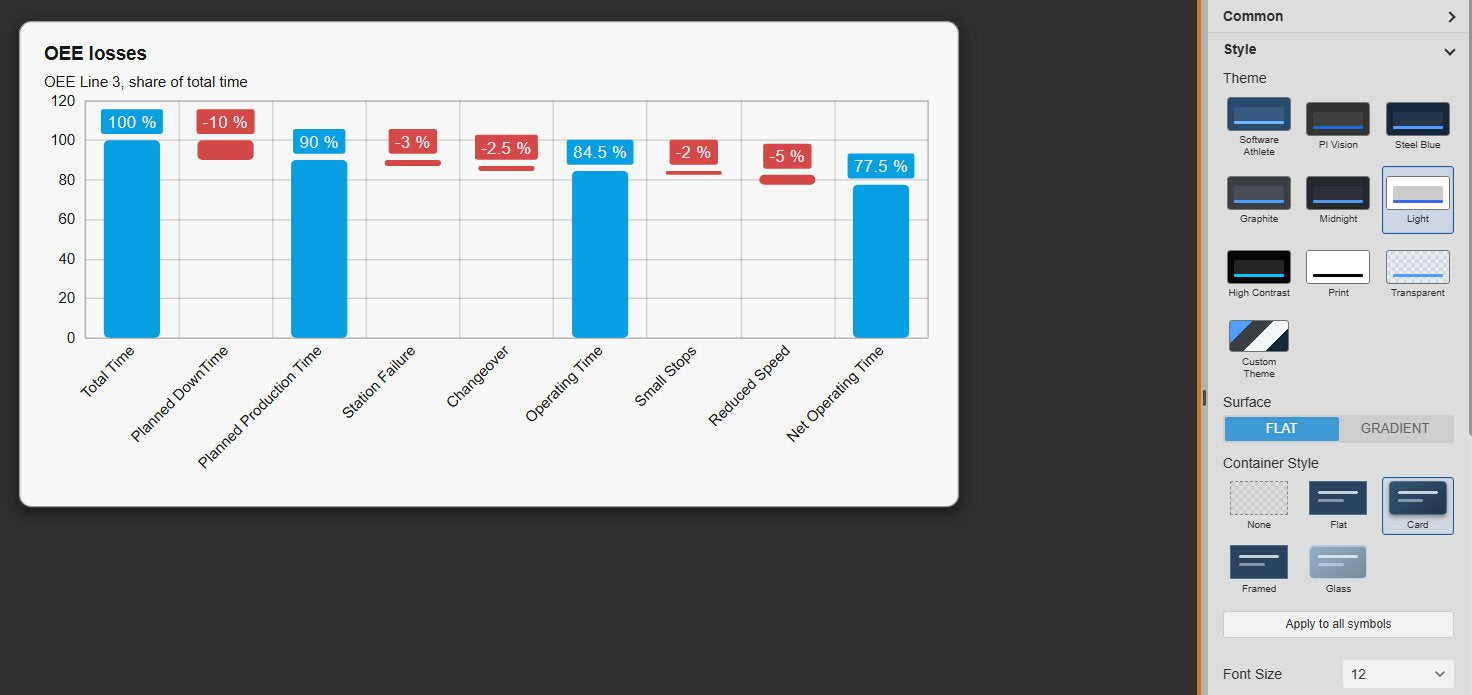
Waterfall Chart+ in the Light theme with a card container on a dark PI Vision display, titled OEE losses with a subtitle, next to the Style settings with the theme grid, surface, container style and the Apply to all symbols button
Light theme with a card container, next to the Style settings. Demo data. Select the image to enlarge.

PI Vision waterfall chart examples

Four common ways teams use Waterfall Chart+ on their displays.

OEE loss breakdown

Data
Total time, planned downtime and availability, performance and quality losses from AF analyses
Settings
Planned production, operating and net operating time as totals, losses as negative values
Shows
Which loss takes the most time away from the line

Energy balance

Data
Energy supplied to an area and the consumption of each unit
Settings
Supply as the first total, consumers with Invert on, value type Average over the display time range
Shows
Where the energy goes, unit by unit

Material or stock balance

Data
Opening stock, receipts, shipments, consumption and closing stock
Settings
Opening and closing stock as totals, movements as relative bars
Shows
How the stock level got from opening to closing

Output against plan

Data
Planned output and the deviation for each cause, calculated upstream
Settings
Plan as the first total, deviations as relative bars, actual output as the last total
Shows
Why actual output differs from plan, and by how much

Waterfall Chart+ FAQ

Questions we are asked most often. Read the Waterfall Chart+ documentation or ask a technical question.

When should I use a waterfall chart instead of a bar chart in PI Vision?

Use Waterfall Chart+ when the values form a sequence that adds up, for example total time minus each loss, or opening stock plus receipts minus shipments. When the values are independent of each other, a standard bar chart is easier to read.

Does Waterfall Chart+ calculate the losses for me?

No. The chart shows each data source as provided. Calculate relative values such as losses or deviations upstream, for example with AF analyses, and map them to the chart in the order they should be applied.

How do I mark the start, end and checkpoint bars?

Switch on Total for each data source that holds an absolute value, such as the result or an intermediate checkpoint. The first bar is always a total. All other bars are applied as increases or decreases to the running total.

Our losses are stored as positive numbers. Do we need new attributes?

No. Switch on Invert for those data sources, and the chart subtracts them from the running total instead of adding them.

What do we need to run it?

PI Vision 2021 or later with PI Web API, and PI AF Server 2018 SP2 or later. Waterfall Chart+ runs in PI Vision and uses each user’s existing PI permissions.

How do we get Waterfall Chart+?

Waterfall Chart+ is part of Vision Library+, together with the other Vision Library+ symbols. Request a trial to test it in your own PI Vision environment.

Try Waterfall Chart+ in your PI Vision

Waterfall Chart+ is included in Vision Library+, the PI Vision custom symbol library from Software Athlete. Test it on your own displays and data.