Time Series Table+ for AVEVA PI Vision

PI Vision time series table with grouping, totals and export

Read PI System history as exact values, one row per timestamp. Time Series Table+ shows recorded, interpolated or summary values of several PI points or AF attributes in your PI Vision display, groups them by day or hour, adds totals and exports the table to Excel or PDF.

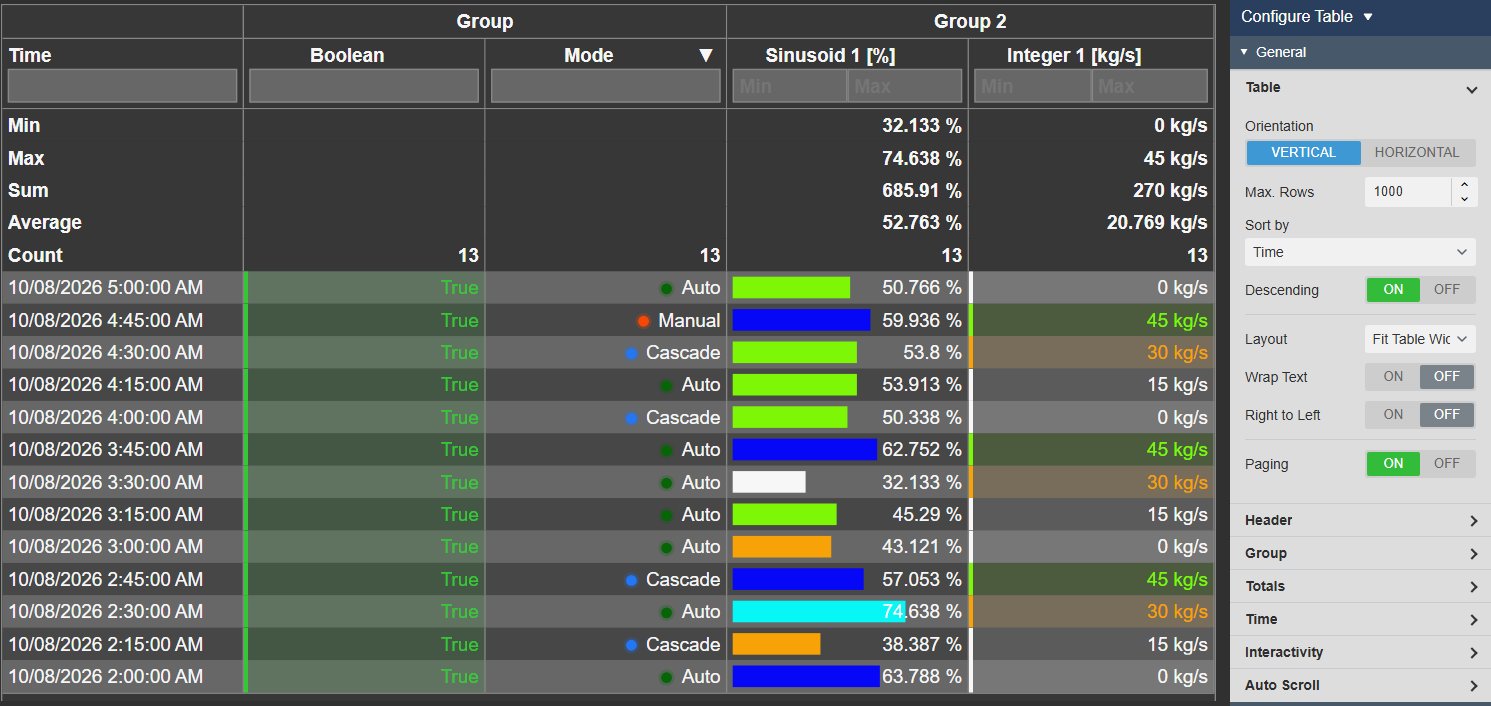
Time Series Table+ in PI Vision with one row per 15 minutes, a time column and four data source columns under two column group headers, minimum, maximum, sum, average and count rows on top, filter boxes below the headers and multi-state progress bars on one column, next to the Table settings with orientation, maximum rows, sort by, descending, layout, wrap text, right to left and paging
Time Series Table+ v2.0 in PI Vision: interpolated values of four data sources with totals on top, next to the Table settings. Demo data. Select the image to enlarge.

Time series data in a PI Vision table

Add PI points or AF attributes, choose how their values are retrieved, and read every timestamp as a row or as a column.

Recorded, interpolated, summary or joined values

Show the archive exactly as recorded, or let the PI System calculate the values the table needs.

  • Recorded values exactly as archived, or interpolated values at a fixed interval with an optional sync time.
  • Summaries per interval: total, average, minimum, maximum, range, standard deviation, count or percent good, time or event weighted.
  • Joined: one data source sets the timestamps, the others are interpolated to them.
  • Display time range, a custom start and end, or a duration with an offset; a Time Bar gives the table its own range.
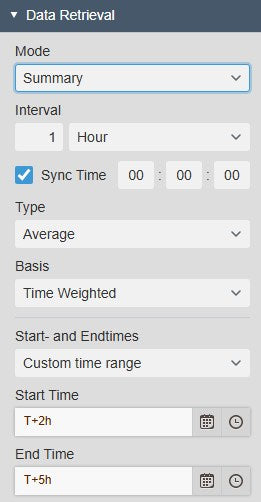
Time Series Table+ Data Retrieval settings with Mode Summary, a one-hour interval, sync time 00:00:00, Type Average, Basis Time Weighted and a custom time range from T+2h to T+5h
Summary values per hour, averaged time weighted. Select the image to enlarge.

Timestamps as rows or as columns

Keep the familiar layout with one row per timestamp, or turn the table round to compare a few data sources across many timestamps.

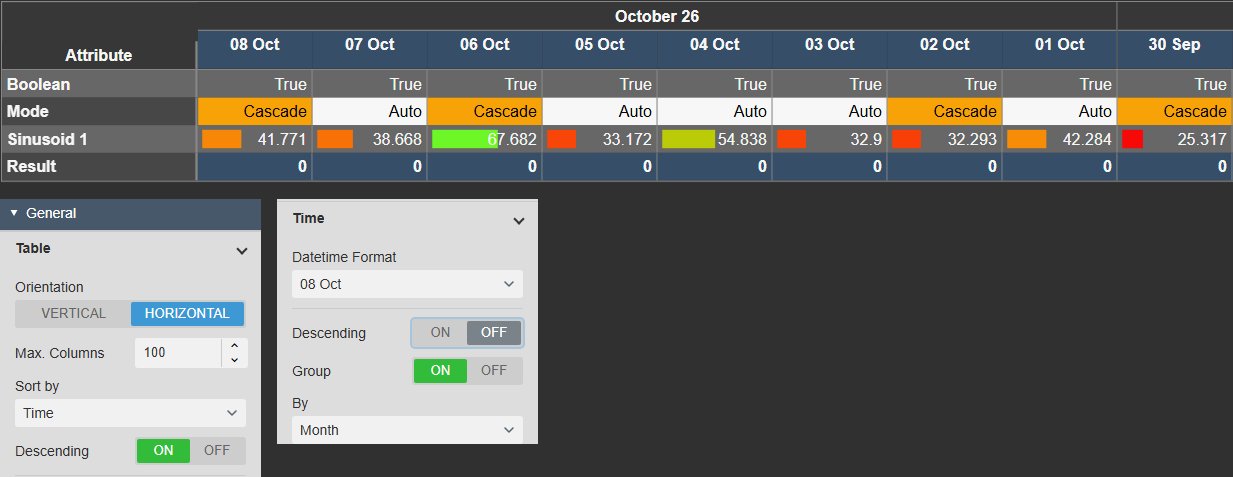
  • Vertical: timestamps as rows; horizontal: timestamps as columns and data sources as rows, grouped under one header per month or another time level.
  • A maximum number of rows or columns, sorted by time or by the values of one numeric data source.
  • Timestamp formats from time of day to weekday or week number, with or without milliseconds, and a pinned time column.
  • Column labels from the attribute, asset or PI point name, with units and column groups; delimited strings can be split into separate columns.
Time Series Table+ in horizontal orientation with the data sources Boolean, Mode, Sinusoid 1 and Result as rows and one column per day under the month header October 26, multi-state fills on Mode and Sinusoid 1, above the Table settings with Orientation Horizontal and Max. Columns and the Time settings with Group By Month
Daily values with the table turned round and the days grouped by month. Demo data. Select the image to enlarge.

Group, total and filter time series data

Turn long lists of values into readable blocks per day or hour, and find the values that matter.

Time grouping by year, month, week, day, hour or minute

Combine several levels into an expandable tree, so readers open the day or hour they need.

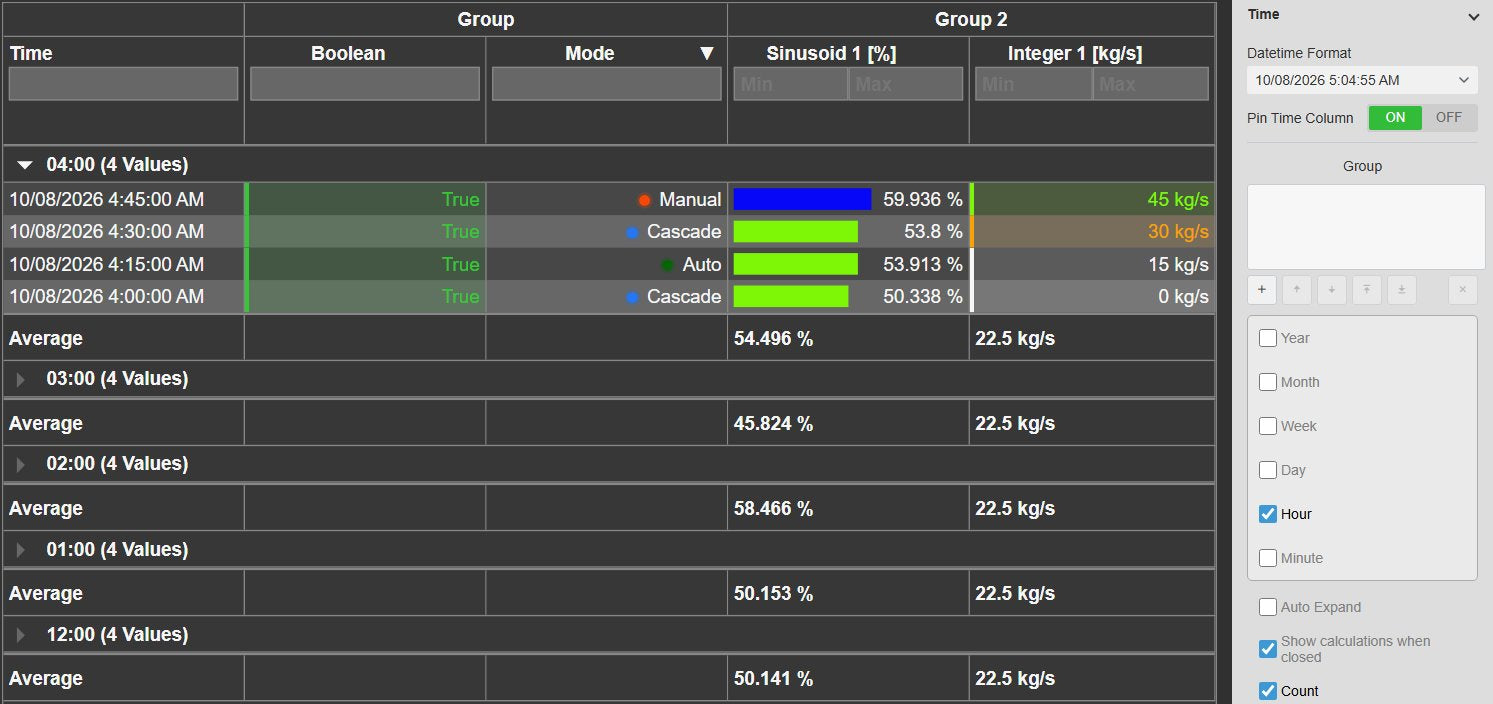
  • Groups by year, month, week, day, hour or minute, alone or nested, for example day and hour.
  • Groups that start expanded or collapsed, with the number of values in each group.
  • A total per group, such as the hourly average, that stays visible while the group is closed.
  • Background, text and border colours for the time column, on all timestamps or weekends only.
Time Series Table+ with 15-minute values grouped by hour, the 04:00 group expanded with four values and the other hours collapsed, an average row below every hour, next to the Time settings with Hour grouping, Auto Expand, Show calculations when closed and Count
Values grouped by hour with an average per hour, one hour expanded. Demo data. Select the image to enlarge.

Totals, filters and sorting

Add the figures readers would otherwise calculate by hand, and narrow the table to the values they are looking for.

  • Average, sum, minimum, maximum and count per column, as one row at the top or bottom or as several rows on top.
  • Count Specific counts only the values that meet a condition you set per column.
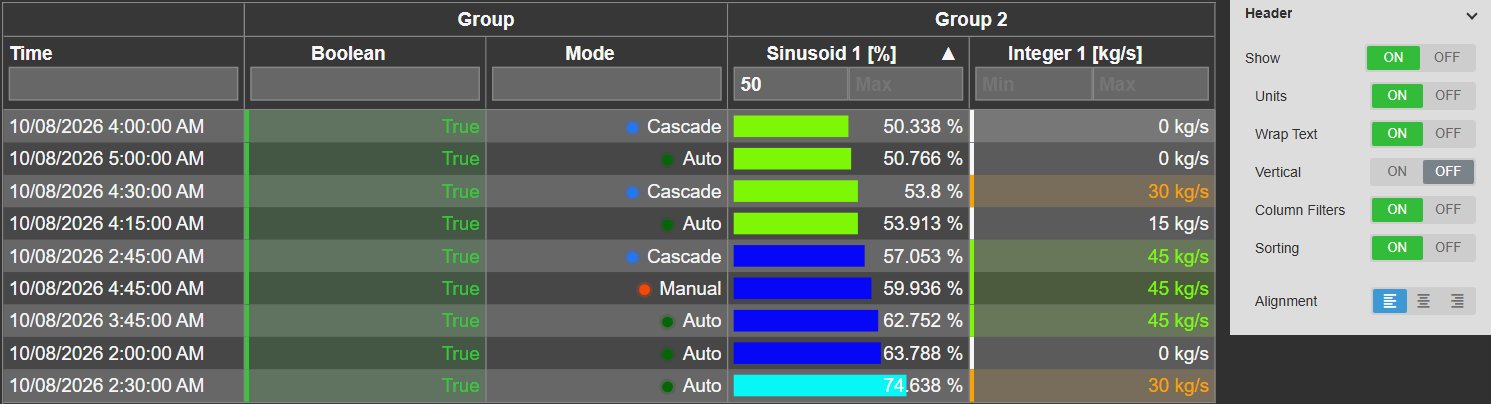
  • Filters below the headers: minimum and maximum for numbers, a pick list of states for digital values.
  • Sorting by any column, data source filters that load only matching values, and a Quick Trend from a column header.
Time Series Table+ in view mode with a minimum of 50 typed into the Sinusoid 1 filter, nine remaining rows sorted by Sinusoid 1 in ascending order, next to the Header settings with Units, Wrap Text, Column Filters and Sorting switched on
A minimum filter on one column and the rows sorted by its values. Demo data. Select the image to enlarge.

Highlight and export PI Vision table data

Make out-of-range values stand out on the display and hand the same table on as a file.

Multi-state colours for values and whole rows

Colour each value by its state, or let one data source colour the whole timestamp, so readers see at a glance when a limit was crossed.

  • Text, border, soft fill, accent and tint, status dot, value badge, solid fill, progress bar or progress bar with value per data source.
  • Limits from AF attribute traits or set in PI Vision; text patterns with * for string values.
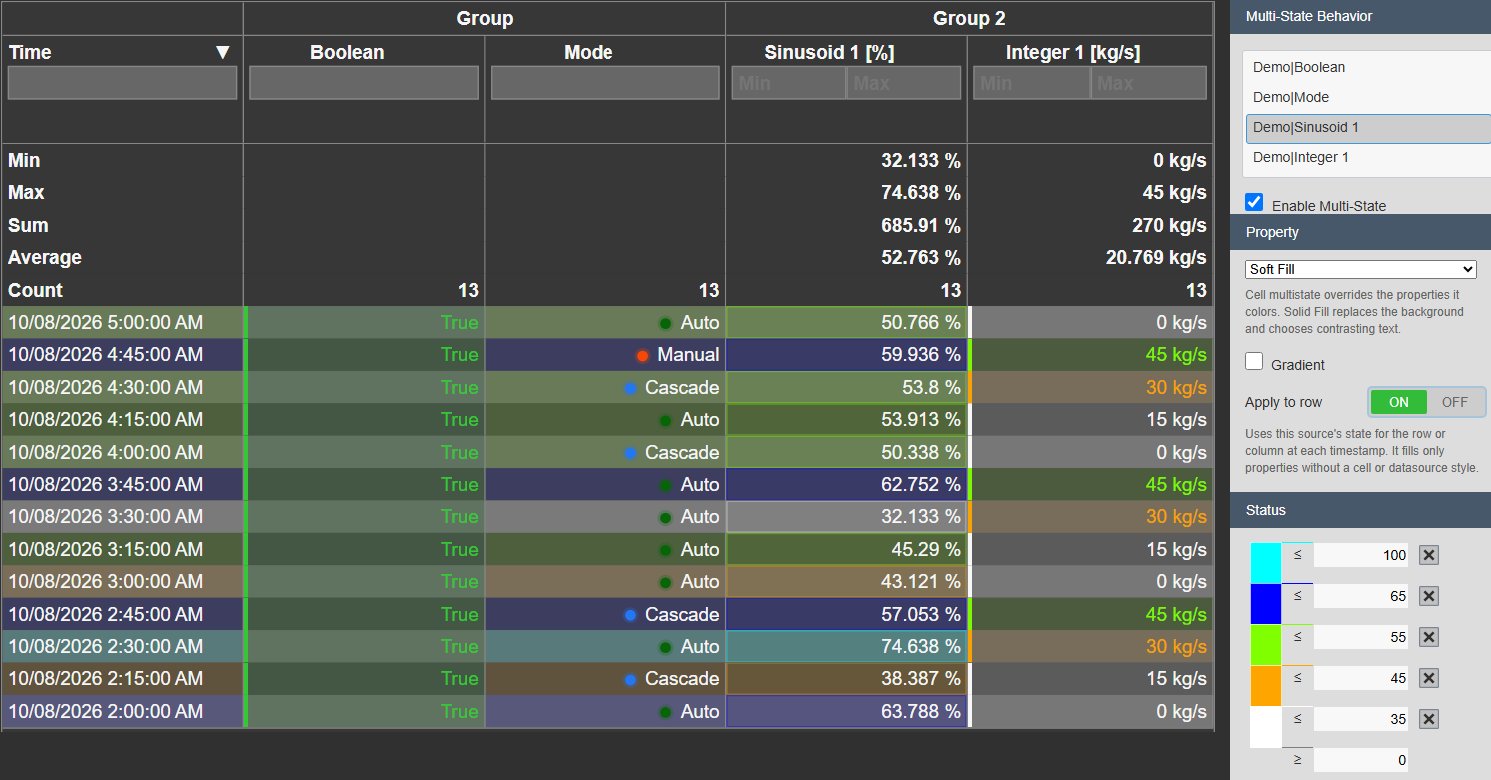
  • Apply to row colours the timestamp row from one source’s state, or the timestamp column in horizontal orientation.
  • Fixed colours and bold per data source, built-in themes, and a custom table style you can copy to other Vision Library+ tables.
Time Series Table+ with soft-fill multi-state colours on Sinusoid 1 applied to the whole row, so each 15-minute row is tinted by the state of its Sinusoid 1 value, next to the multi-state settings with Property Soft Fill, Apply to row on and five illustrative limits
Multi-state colours on one data source, applied to the whole row. Illustrative limits, demo data. Select the image to enlarge.

Export to Excel, PDF, CSV or JSON

Right-click the table, choose Export Data and download the configured table as a file.

  • Excel (XLSX) and PDF keep the cell colours shown on screen; CSV and JSON contain the data only.
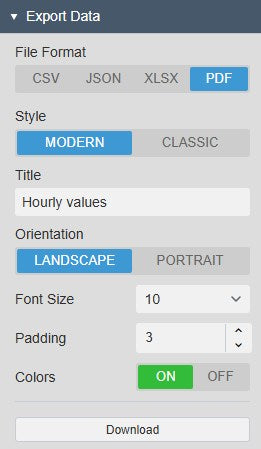
  • PDF with a title, landscape or portrait, font size, cell padding, colours on or off and a modern or classic style.
  • Administrators can switch data export off for all Vision Library+ symbols.
Time Series Table+ Export Data settings with the file formats CSV, JSON, XLSX and PDF, PDF selected, and the PDF Style, Title, Orientation, Font Size, Padding and Colors options above the Download button
Export Data with the PDF options. Select the image to enlarge.

PI Vision time series table examples

Four common ways teams use Time Series Table+ on their displays.

Hourly production per line

Data
Speed and production amount of two production lines
Settings
Summary mode with a one-hour interval, time grouping by day, average and sum rows on top
Shows
Each hour’s figures in daily blocks, with the totals readers need for a shift or day

Lab results next to process values

Data
Manually entered lab PI points and the matching process tags
Settings
Joined mode with the lab point as the time reference
Shows
Every lab sample beside the process values at the same timestamp

Checking raw archive data

Data
Recorded values of a sensor under suspicion
Settings
Recorded mode, timestamps with milliseconds, minimum and maximum column filters
Shows
Every archived value with its exact timestamp, to check gaps, spikes and compression

Monthly table for Excel

Data
Daily values of production or consumption tags
Settings
Summary mode with a one-day interval, multi-state colours, Export Data as XLSX
Shows
A month of daily values with their colours, ready to share as a spreadsheet

Time Series Table+ FAQ

Questions we are asked most often. Read the Time Series Table+ documentation or ask a technical question.

Which table symbol should I use?

Use Time Series Table+ to read the history of PI points or AF attributes as values by timestamp, recorded, interpolated or summarised, with grouping, totals and export; it does not change any values. Alarm Table+ turns limit conditions on AF attributes into alarm rows, current or historical, with acknowledgement and sound. SQL Table+ shows the rows of an AF table, such as reference data, a linked CSV file or a SQL table. To add, correct or delete archive values, use Manual Input Table+; to compare the current values of many assets, use Asset Comparison Table+.

Which retrieval mode should I choose?

Recorded shows every archived value exactly as stored, which suits data checks and event reviews. Interpolated returns values at a fixed interval, optionally aligned to a sync time. Summary calculates one value per interval, such as an hourly average or a daily total, time or event weighted. Joined takes the timestamps of one data source and interpolates the others to them, for example to line up lab samples with process values.

How many rows can the table show?

Max. Rows, or Max. Columns in horizontal orientation, limits the number of timestamps; the default is 1,000 rows, and Paging splits long tables into pages. Long time ranges with short intervals create many rows and slow the display, so use a summary interval for long ranges, or data source filters, which load only matching values from the PI System. Column filters work on the values already loaded.

Can we export the table to Excel?

Yes. Right-click the table, choose Export Data and download it as XLSX, PDF, CSV or JSON. XLSX and PDF keep the cell colours shown on screen; CSV and JSON contain the data only. Administrators can switch data export off for all Vision Library+ symbols in its configuration file.

What do we need to run it?

PI Vision 2021 or later with PI Web API, and PI AF Server 2018 SP2 or later. Time Series Table+ runs in PI Vision, reads data with each user’s existing PI permissions and does not write values.

How do we get Time Series Table+?

Time Series Table+ is part of Vision Library+, together with the other Vision Library+ symbols. Request a trial to test it in your own PI Vision environment.

Try Time Series Table+ in your PI Vision

Time Series Table+ is included in Vision Library+, the PI Vision custom symbol library from Software Athlete. Test it on your own displays and data.