



PI Nexus+ / Installation and Administration
11. Configure Inventory Targets
Inventory targets control scan scope:
Overview
Inventory targets control scan scope:
- Discovery lists possible targets.
- PI Nexus+ scans only targets that an administrator enables.
- Review the list before enabling targets to avoid an accidental full-environment scan.
11.1 PI Data Archives
Use Admin > PI Data Archives to configure which PI Data Archive servers PI Nexus+ will scan for PI Points.
PI Data Archive scans collect tag metadata, rule matches, health status, point attributes, snapshot information where configured, and dependency relationships to AF and PI Vision where available. If a PI Data Archive is not enabled here, PI Point scans skip it.
Steps:
- Go to Admin > PI Data Archives.
- Wait for discovery to list available PI Data Archive servers.
- Enable each server that should be included in scans.
- Use Test where available to confirm access from the PI Nexus+ server.
- Open the target's Actions menu and select Test Module DB when PI Interface Intelligence is required.
- Refresh the page and confirm enabled servers remain enabled.
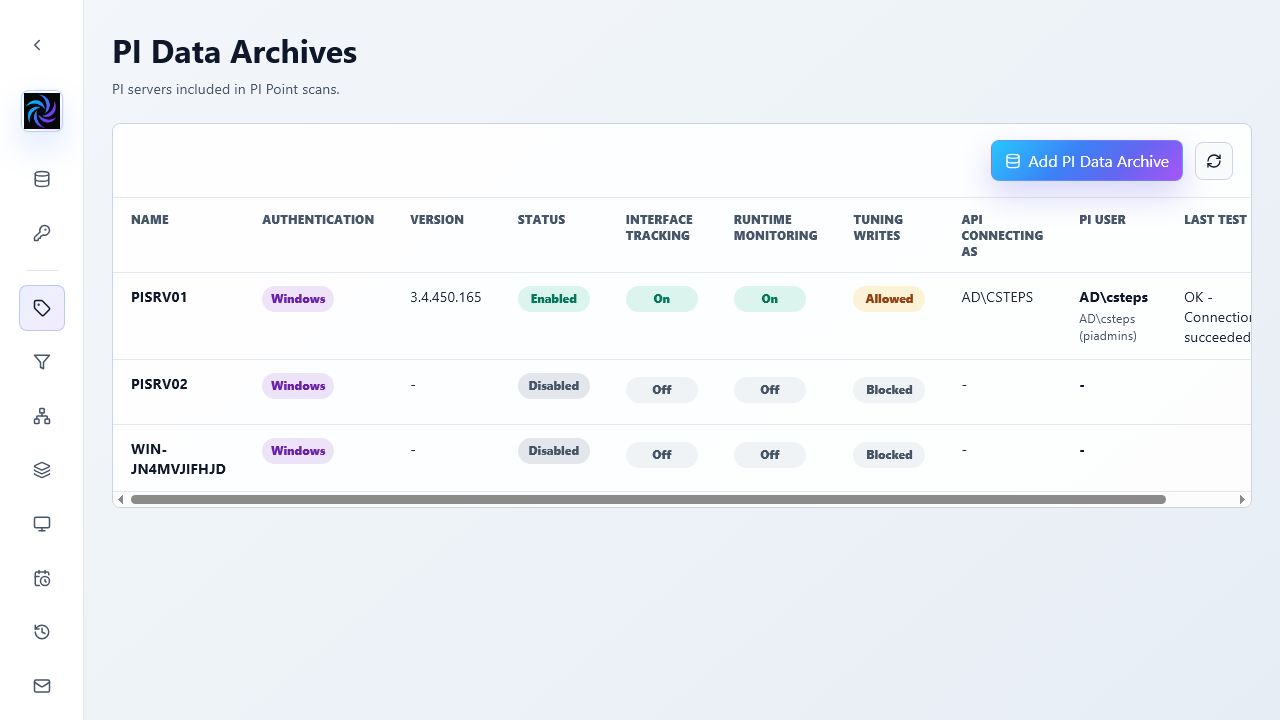
Enable only the servers that belong in the PI Nexus+ inventory. For example, if a site has PISRV01 for production and PISRVTEST for development, enable only the production server unless the development server should also be inventoried.
A good result for this section is that the intended PI Data Archive servers are enabled and discovery does not disable them after refresh.
11.1.1 Optional PI Interface Tracking and Runtime Monitoring
Use this feature only when legacy PI Interfaces need to be inventoried. For each PI Data Archive, confirm these prerequisites:
- The 64-bit legacy PI SDK is installed as described in Section 3.1.
- The PI Data Archive target uses Windows authentication.
- The PI Nexus+ service account can connect to the PI Data Archive and read
%OSI\Interfaces.
To enable Interface Tracking:
- Open Admin > PI Data Archives.
- Open the target's Actions menu and select Enable Interface Tracking.
- Select Test Module DB and confirm the test succeeds with the expected Windows identity.
- Run a PI Point or Full Inventory scan.
- Open PI Interfaces and confirm that the expected interfaces appear.
To add live runtime health:
- Return to Admin > PI Data Archives.
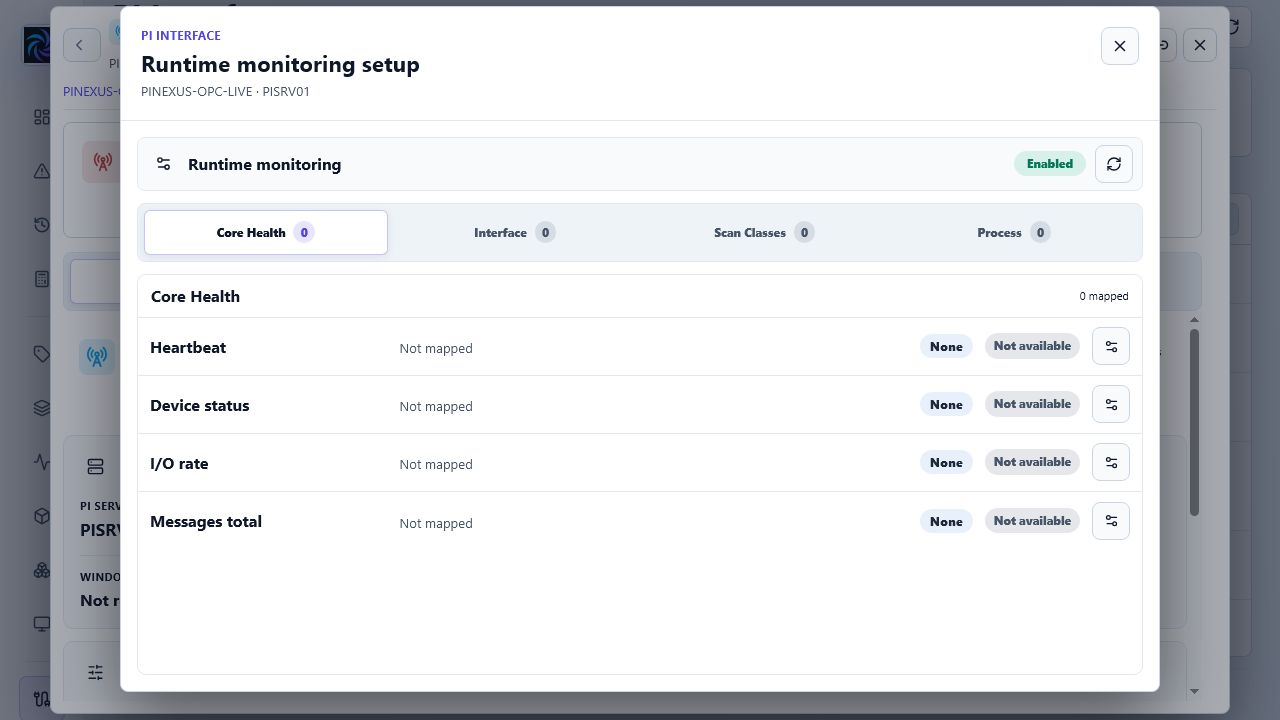
- Open the target's Actions menu and select Enable Runtime Monitoring.
- Open a discovered PI Interface and select Monitoring setup.
- Select Rediscover Runtime Points when standard health points were added or changed.
- If an older interface has no discoverable health points, configure an exact PI Point for each available Core Health signal.
What to expect:
- Interface Tracking and Runtime Monitoring are off by default and configured per PI Data Archive.
- Runtime Monitoring cannot be enabled until Interface Tracking is on. Disabling Interface Tracking also disables Runtime Monitoring.
- The inventory scan is read-only and does not store Module Database credentials or arbitrary property bags.
- Configuration Health, mapped-tag Data Health, and Runtime remain separate so a mapping problem is not mistaken for a process outage.
- Optional interface, scan-class, and process counters appear as unavailable when they are not installed or discoverable; their absence alone does not make the interface unhealthy.
11.2 AF Servers and Databases
Use Admin > AF Servers to configure which AF servers and AF databases PI Nexus+ will scan.
AF scans collect AF attributes, analyses, analysis inputs and outputs, limit traits, data references, health status, and dependency relationships. AF servers are configured first, then individual databases are enabled under the selected server. This lets an administrator scan only the relevant AF databases instead of scanning every database on an AF server.
Steps:
- Go to Admin > AF Servers.
- Wait for discovery to list available AF servers.
- Enable the AF server that should be scanned.
- Select the enabled server.
- Review the AF database list for that server.
- Enable the AF databases that should be included in scans.
- Use Test where available to confirm access.
- Refresh the page and confirm enabled databases remain enabled.
For each AF server, configure AF Attribute value evaluation:
- All attributes preserves the legacy behavior and reads every current value exposed by AF SDK.
- Operational attributes inventories every attribute but skips current-value reads for attributes with no data reference, Configuration Item attributes, hidden attributes, and excluded attributes. Manual Data Entry attributes remain evaluated. Skipped values are recorded as Not Evaluated.
- Inventory only inventories AF structure, metadata, analyses, and dependencies without reading any AF Attribute current values.
The mode belongs to the AF server. It does not disable databases or remove attributes from inventory.
When an attribute becomes eligible for an operational skip, the next successful AF scan stores its value health as Not Evaluated and clears its prior AF Attribute issue during post-scan issue synchronization. A linked PI Point remains independently inventoried and can retain its own PI Point issue; PI Point health does not overwrite the skipped AF Attribute state.
Disabled, stopped, and not-ready AF Analyses remain in inventory with their status, configuration, inputs, outputs, and dependencies, but PI Nexus+ does not execute their analysis rules or populate their current-time inputs during health evaluation. Runtime performance counters are collected for running analyses only.
AF scan logs report the selected value-evaluation mode, database and phase timing, current-value reads, skips by reason, PI Point value reuse, adaptive batch fallbacks, read errors, and slow batches. Use these counters to confirm that an operational scan is excluding the expected attributes and to isolate database or data-reference performance problems.
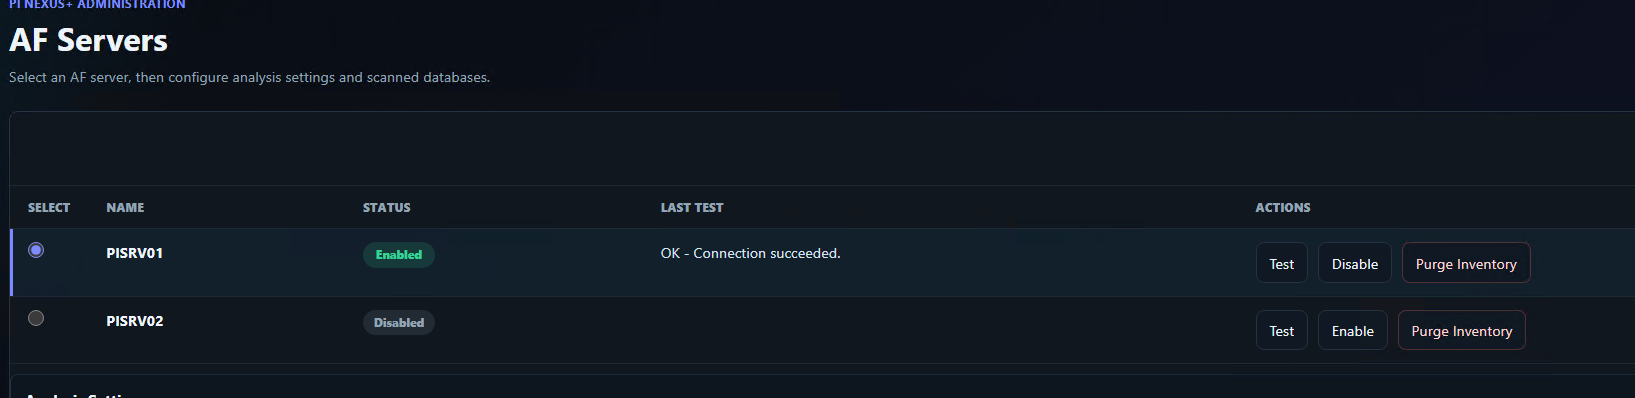

For a first run, choose a small or representative AF database before enabling a large production database. This makes it easier to validate permissions, runtime behavior, and scan results before a full scan.
A good result for this section is that the intended AF server is enabled, the correct databases are enabled, and disabled databases are intentionally excluded from scans.
11.3 (Optional) Using OpenID Connect
To configure OpenID Connect, first open the PI Data Archive or AF Server target in the Admin area and change its authentication mode from Windows to OpenID Connect.
Then open Admin > OpenID Connect and copy the PI Nexus+ client ID and client secret. On the PI/AF side, register this client with AVEVA Identity Manager, for example by using the provided PowerShell command shown in the PI Nexus+ OpenID Connect page. Run that command on the server running AVEVA Identity Manager. For example:
Add-IdentityManagerClient -HostBase https://<identity_manager_fqdn>:444 `
-Id "PINexus_App_PISRV01" `
-AllowedGrantTypes ClientCredentials `
-ScopeRestrictions openid, system, profile `
-Secret "<Secret>"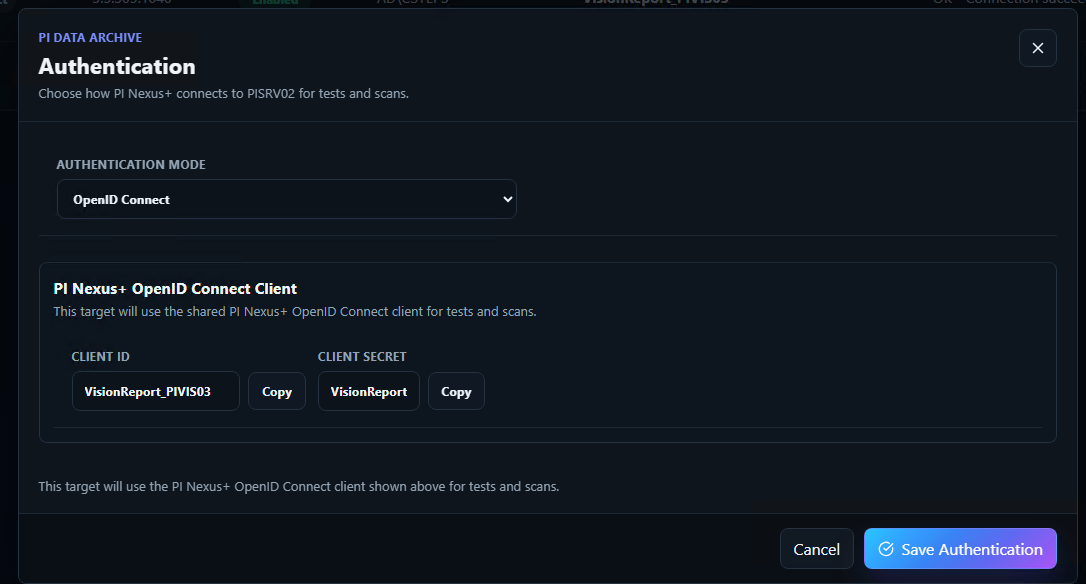
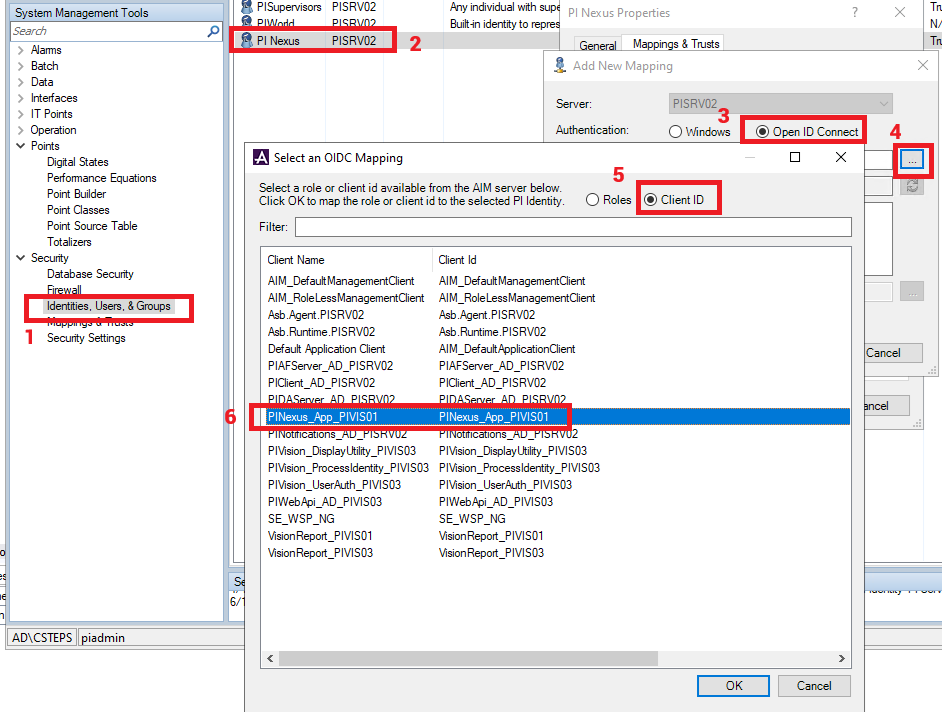
After the client is registered, map the OpenID Connect client identity to the required PI Identity or AF Identity. This mapped identity must have the same permissions that the scanner needs: read access to PI Points, AF databases, elements, attributes, analyses, and any PI Vision-related data sources that should be inventoried. Once the mapping is complete, return to PI Nexus+, test the target connection, and enable the target for scanning.
The legacy PI SDK Module Database path supports Windows authentication only. A PI Data Archive target configured for OpenID Connect continues to scan PI Points normally, but PI Nexus+ skips PI Interface discovery for that target and reports the capability as unsupported for that authentication mode.
11.4 PI Vision Instances
Use Admin > PI Vision Instances to configure PI Vision display inventory. PI Vision inventory is optional. If PI Vision is not used, leave this section unconfigured.
PI Nexus+ reads PI Vision display metadata from the PI Vision SQL database. This allows PI Nexus+ to show which displays use a PI Point, AF attribute, AF analysis result, or dynamic limit trait. It also enables dependency graphs from PI Vision displays back to AF and PI Data Archive objects.
When adding a PI Vision instance, enter:
| Field | Meaning |
|---|---|
| Name | Friendly name shown in PI Nexus+, for example PI Vision Production |
| URL | PI Vision web URL, used for display links and ad hoc workspace links |
| SQL Server | SQL Server hosting the PI Vision database |
| Database | PI Vision database name |
| Enabled for scanning | Whether this PI Vision instance is included in manual and scheduled scans |
| Unused display check | Marks displays as unused when they have not been opened for the configured number of days |
| Unused after days | Number of days used by the unused display check |
| Missing datasource health | Health level assigned when a display datasource cannot be matched |
| Error datasource health | Health level assigned when a datasource has an error |
| Warning datasource health | Health level assigned when a datasource has a warning |
Steps:
- Go to Admin > PI Vision Instances.
- Add a PI Vision instance.
- Enter the PI Vision URL and SQL database details.
- Configure display health rules.
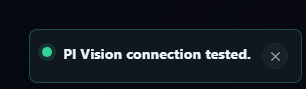
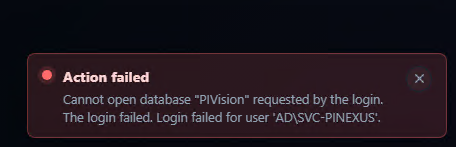
- Click Test.
- Save the instance.
- Enable it for scanning.
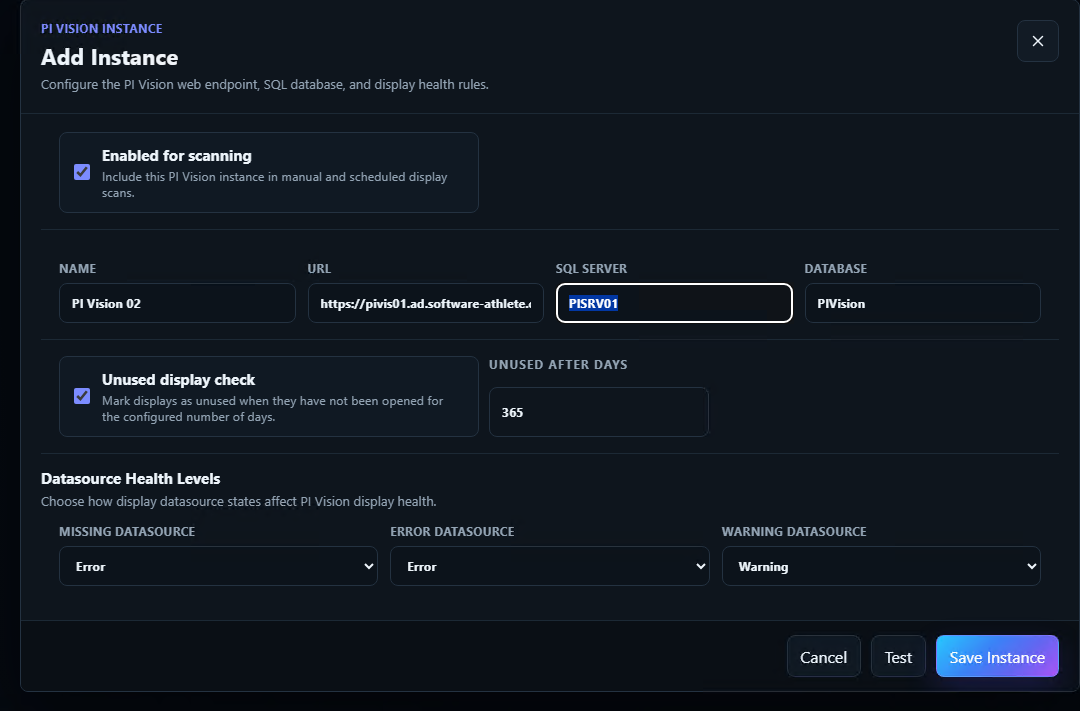
Example: If PI Vision displays are considered operationally important, set missing datasources to Error. If PI Vision is used mainly for ad hoc views, set missing datasources to Warning so the issue is visible but does not dominate the dashboard.
A good result for this section is that the PI Vision instance test succeeds and the instance is enabled only if it should be included in scans.
11.5 PI Point Rules
Use Admin > PI Point Rules to define how PI Nexus+ evaluates PI Point health. PI Point Rules are important because different environments have different expectations for stale data, compression behavior, point sources, and valid value ranges.
Rules are evaluated against PI Points during PI Point scans. A rule can match a broad group of tags, such as all tags, or a narrow group, such as one point source or naming pattern. The matched rule determines which health checks apply to that PI Point and whether each finding is ignored, shown as a warning, or treated as an error.
Common rule concepts:
| Field or setting | Purpose |
|---|---|
| Rule name | Human-readable name, for example All Tags or Lab Tags |
| Enabled | Whether the rule is active during scans |
| Match criteria | Determines which PI Points the rule applies to, such as point source or name pattern |
| Scan and evaluate matching PI Points | When enabled, matching PI Points are active inventory and health checks run. When disabled, matching PI Points are excluded, shown as Not Evaluated, and later rules are not evaluated for them. |
| Rule reason | Optional note explaining why a rule intentionally ignores or downgrades expected states |
| No Data severity | Controls whether No Data is ignored, warning, or error |
| Pt Created severity | Controls whether tags that have never received a value are ignored, warning, or error |
| Bad Value severity | Controls other bad latest-value states |
| Stale severity | Checks whether the tag has received a fresh value within the configured time window |
| Stale threshold | Number of days or hours after which a point is considered stale |
| Range severity | Optional zero/span or configured range used to flag out-of-range values |
| Tag Naming Pattern | Guided builder for PI Point tag naming conventions |
| Point Attribute Checks | Optional advanced checks for PI Point metadata or the virtual Tag name field |
| Data Flow | Reusable external systems that feed matching PI Points or receive their data |
Example rule structure:
| Scenario | Example setup |
|---|---|
| General production tags | Match all tags, No Data warning, bad value error, stale warning after 30 days |
| Fast interface tags | Match point source R, stale warning after 1 day |
| Manual or lab tags | Match point source L, ignore No Data or stale checks with a rule reason |
| Calculated tags | Match naming pattern such as *.Calc.*, stale threshold based on calculation schedule |
| Dot-separated tag names | Use the Tag Naming Pattern tab to create a Tag name regex check such as ^[A-Z0-9]+(?:\.[A-Z0-9]+){1,}$ |
Use more specific rules for exceptions. For example, if most tags should be stale after 30 days but lab tags are expected to update rarely, create a specific lab rule and set stale severity to Ignored or Warning so those tags are not reported as false positives. If a state is expected, add a short rule reason so another administrator can understand the exception later.
For naming conventions, open a PI Point Rule and use the Tag Naming Pattern tab to generate a regex-backed check without writing the expression manually. The builder is only a helper; PI Nexus+ stores the result as a normal point attribute check where Tag name must match the generated pattern. For example, a dot-separated uppercase tag convention flags TAG1_PV or TAG1-PV while allowing TAG1.PV.
Compression Tuning
The Compression Tuning tab controls whether PI Points matched by this rule are eligible for compression analysis. This is a scope decision, not an automatic write permission: enabling the rule makes matching points available to a tuning run, but recommendations still require review and manual application.
Use the setting when a group of tags shares the same process behavior or operational risk. For example, enable tuning for stable analog production signals, but leave it disabled for calculation outputs, event-like tags, or points that should not be changed until their owners have reviewed them.
Configure the tab as follows:
- Open an existing PI Point Rule and select Compression Tuning. Save the rule before configuring rule checks or tuning eligibility if the rule is new.
- Enable Candidate for compression tuning only when matching PI Points may be included in future tuning runs.
- Leave Signal profile set to Auto detect (Recommended) unless the signal behavior is well understood and a fixed profile is required. Fixed profiles include general analog, slow/smooth, peak-sensitive, step/event, and noisy/high-frequency behavior.
- Choose Normal protection for ordinary signals. Choose Critical when peaks, transitions, or data fidelity require tighter safeguards and individual review before applying a recommendation.
- Save the rule and select it when creating a Compression Tuning run or Auto Tune plan.
Before running tuning, go to Admin > PI Data Archives and use the target's Allow Tuning Writes action only after the archive owner has approved the workflow. This permission allows PI Nexus+ to temporarily adjust exception settings during observation and restore them afterward; it does not authorize final compression changes. The final recommendation remains a separate, manual action.
The rule's candidate setting and profile provide the default scope and guardrails. A tuning run may still be narrowed to selected points, and individual points can be skipped or excluded later. Review the Compression Tuning run results, comparison trends, and restore status before applying any recommendation.
Data Flow
The Data Flow tab records where the PI Points matched by a rule receive data from and where they send data. Configure this at the rule level so one relationship covers a matching group of tags instead of maintaining integrations point by point.
- Open the rule that owns the integration path and select Data Flow.
- Add an External System under Sources when it feeds data into PI.
- Add an External System under Targets when PI sends data to it.
- Add an optional connection label such as
OPC DA,PI Integrator export, orCONNECT agentwhen the protocol or path will help during incident response. - Save the rule.
The direction appears in dependency graphs as External system -> PI Point for a source and PI Point -> External system for a target. A system can be assigned in both directions. These assignments describe topology and ownership; they do not test whether the external interface is online. See section 11.6, External Systems and PI Point Data Flow, for system configuration, data-health policies, and maintenance guidance.
Assignment-only changes apply immediately to already classified active points. Changing match criteria or rule priority requires a PI Point scan because ownership must be recalculated. The first matching enabled rule owns a point, so keep broad catch-all rules below more specific integration rules. Points that match no enabled rule are excluded and have no rule-based Data Flow relationship.
Steps:
- Go to Admin > PI Point Rules.
- Review the default rules.
- Add or edit rules to match the environment.
- Confirm
No Data,Pt Created, bad value, stale, compression, range, tag naming, and point attribute checks. - Open Data Flow and assign any external Sources or Targets. Add a connection label when the protocol or integration path is useful during incident response.
- Run a scoped PI Point scan.
- Review warning and error results.
- Adjust rules if expected tags are being flagged incorrectly.
A good result for this section is that the PI Point health checks reflect the environment's actual operating expectations.
11.6 External Systems and PI Point Data Flow
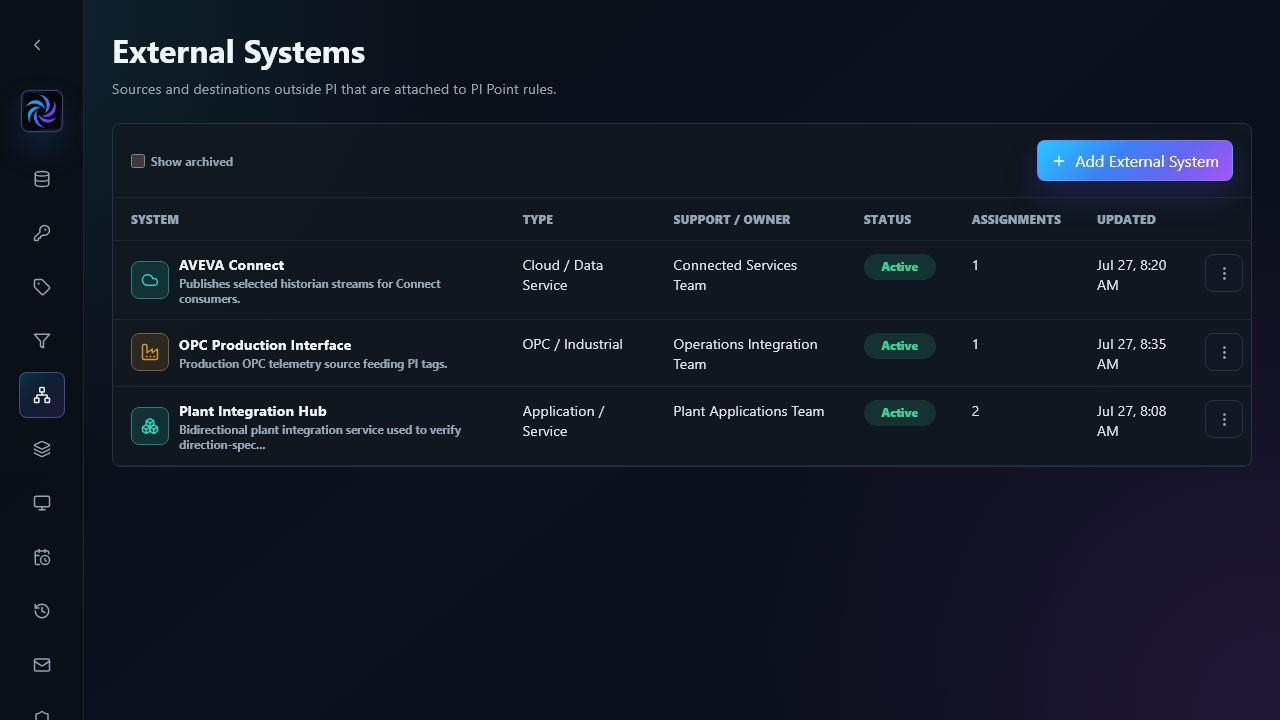
Use Admin > External Systems to maintain systems outside the PI System that provide or consume PI Point data. Examples include OPC interfaces, plant control systems, SQL databases reached through PI Integrator for Business Analytics, ERP or MES platforms, AVEVA CONNECT, and custom applications.
Why use External Systems?
PI Point inventory tells you whether a tag is healthy, but it does not by itself explain where the data came from or where it goes next. External Systems add that operational context to the dependency graph and to the PI Point detail view. This helps an administrator answer questions such as:
- Which interface, application, or plant system is responsible for feeding a missing or bad PI Point?
- Which downstream system may be affected when a PI Point becomes stale or enters an error state?
- Who owns the integration, and where is the runbook for investigating it?
The feature is intentionally a lightweight topology and ownership register. It does not replace interface monitoring, connection testing, credential storage, or a runbook system. PI Nexus+ uses the relationships to make PI Point health actionable without pretending that the external system itself has been tested.
Configure an External System
Each system has a unique name, description, controlled type, fixed-catalog icon, validated hex color, support contact, and optional HTTP/HTTPS runbook URL. These fields are operational documentation; do not enter credentials or secrets. PI Nexus+ does not upload icons or test connectivity.
- Go to Admin > External Systems.
- Select Add External System.
- Enter a clear, stable name. Prefer the name administrators use in the plant or integration architecture, such as
OPC Production InterfaceorAVEVA Connect. - Select the closest System Type. The type is a controlled classification used for consistent administration and graph display; it does not create or test a connector.
- Add a description that explains what the system does and which data or teams depend on it.
- Enter the support team or owner who should be contacted when connected PI Points are unhealthy.
- Add an HTTP/HTTPS Runbook URL when a troubleshooting or operating procedure exists.
- Choose the accent color and icon that make the system easy to recognize in the admin page and dependency graphs.
- Configure the source and target Data Health policies, then save the system.
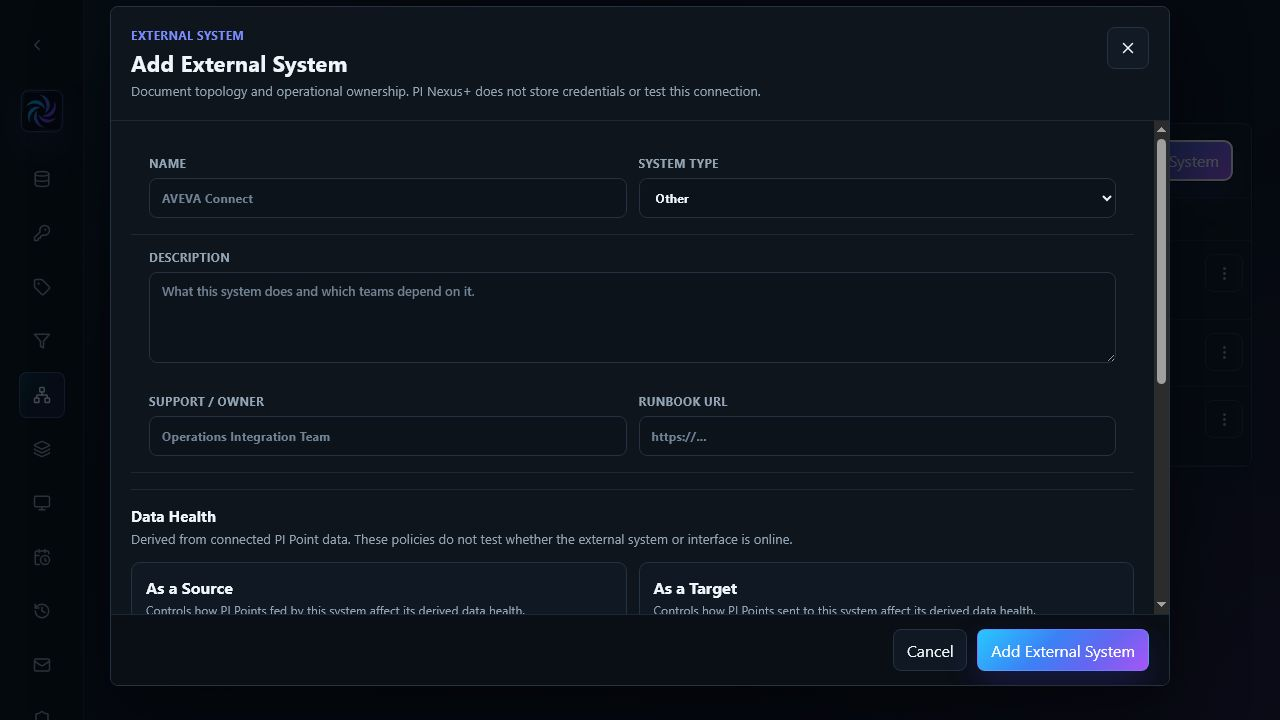
The Data Health policies are independent for the two directions:
| Role | Meaning |
|---|---|
| As a Source | The external system feeds data into matching PI Points. |
| As a Target | Matching PI Points send data to the external system. |
For each role, choose the impact of connected PI Points that are missing, in error, or warning. Missing and Error PI Points default to Error, while Warning PI Points default to Warning. Select Ignore when a condition should remain visible in raw counts without degrading the system. Policy and mapping edits are evaluated immediately and do not require a scan. Derived data health describes the quality and availability of connected PI data; it is not evidence that an OPC interface, database, ERP, cloud service, or application is online or offline.
Link External Systems to PI Points through PI Point Rules
External Systems are linked to tags through the Data Flow tab of the PI Point Rule that owns those tags. This design is important: the relationship is defined once for a matching group of PI Points instead of being maintained separately for every tag.
- Go to Admin > PI Point Rules.
- Identify the rule whose match criteria select the PI Points in the integration path.
- Open the rule's action menu and choose Edit.
- Open the Data Flow tab.
- Add an external system under Sources when it feeds data into PI, or under Targets when it receives data from PI. The same system can be used in both directions.
- Add an optional connection label such as
OPC DA,PI Integrator export, orCONNECT agentwhen the protocol or integration path will help during incident response. - Save the rule.
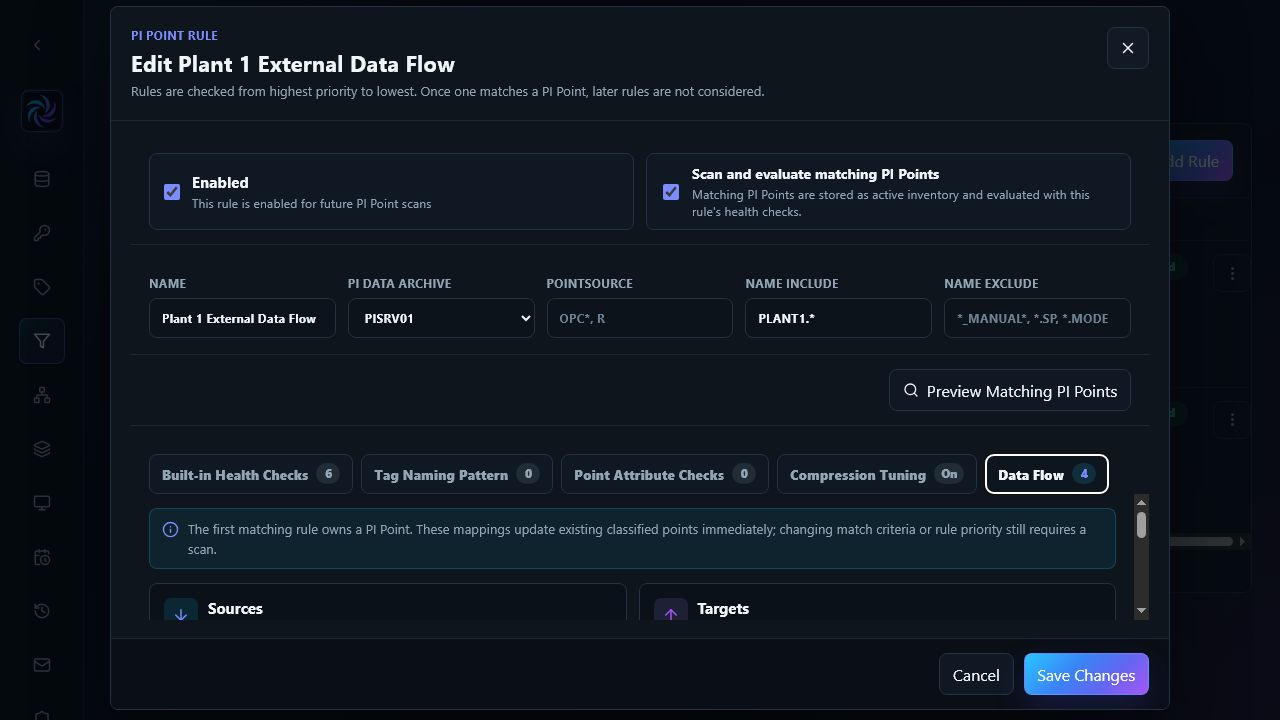
The direction is shown in dependency graphs as External system -> PI Point for a source and PI Point -> External system for a target. A curated inbound source replaces the inferred InstrumentTag source for that point. If all curated inbound sources are removed, the InstrumentTag source appears again as a fallback.
The first matching enabled PI Point Rule owns each PI Point. Data-flow assignments follow that stored ownership. Assignment-only edits appear immediately for already classified active points and do not require a scan. Match criteria or priority changes still require a PI Point scan so ownership can be recalculated. If a point matches no enabled rule, it is excluded and has no rule-based data-flow relationship.
Maintain and use the relationships
Use the resulting relationships during daily administration:
- Open an external-system detail view to review its owner, runbook, assigned rules, derived health, and connected active PI Points.
- Open a PI Point detail view and follow its dependency graph to see curated upstream sources and downstream targets.
- Start with missing, error, warning, and not-evaluated points when investigating a system-level health problem; then use the paginated Connections view for the complete relationship list.
- Keep names, owners, runbook links, and connection labels stable so support staff can use them consistently across scans and incidents.
Archiving is the normal removal workflow. A system cannot be archived while rule assignments remain: remove its Sources and Targets first, then archive it. Archived systems can be restored. If an archived system is no longer needed, an administrator can permanently delete it from the row action menu after confirming its name. Permanent deletion remains blocked while any rule assignment exists and removes the system definition together with its derived issues and issue suppressions; it does not delete PI Point inventory. Uploaded SVG icons, credentials, and connection tests remain intentionally unsupported.
A good result for this section is that every important external data path has a named source or target, an accountable owner, and enough context in the dependency graph for an administrator to begin troubleshooting without searching through undocumented integrations.
11.7 Admin Pages and Settings Reference
The Admin area is the control plane for targets, scanning, access, notifications, diagnostics, and retention. The main pages are summarized below; the linked sections contain the detailed setup procedures.
| Admin page | What to configure or use | Guide coverage |
|---|---|---|
| SQL Server | Windows-authenticated SQL Server and database connection; Test validates the connection and Apply applies the schema. Recycle PINexusAppPool and restart PI Nexus+ Scanner after changing SQL settings. | Sections 5 and 7 |
| License | Upload or paste a signed license, refresh status, or remove the license. A valid license controls access to operational pages and scan starts. | Section 10 |
| OpenID Connect | Global OIDC client settings and secret regeneration when OIDC is used for PI Vision or other configured integrations. | Section 11.3 |
| PI Data Archives | Add or discover PI Data Archives, test connections, enable or disable targets, configure authentication, and allow or block Compression Tuning writes. | Section 11.1 |
| PI Point Rules | Define ordered match criteria, inventory inclusion, health checks, Compression Tuning eligibility, and Data Flow. | Section 11.5 |
| External Systems | Register upstream and downstream systems, owners, runbooks, data-health policies, and rule assignments. | Section 11.6 |
| AF Servers | Configure AF server access and choose the AF databases to scan. | Section 11.2 |
| PI Vision Instances | Configure PI Vision web and SQL connections and test the instance before scanning displays. | Section 11.4 |
| Scan Schedules | Create recurring Full Scan, PI Points, AF, or PI Vision scans, including hourly schedules and selected PI Point Rules. | Section 15 |
| Change Tracking | Enable inventory change events, choose retention, set the maximum history size, and purge history when required. | See below |
| Notifications | Configure SMTP delivery, recipients, scan-result notifications, Auto Tune notifications, PI Interface runtime alerts, optional CSV attachments, and test delivery. | See below |
| Security | Review the current user, map Windows or AD groups to Viewer, Operator, and Admin roles, review security health, and inspect the audit log. | See below |
| Support | Run readiness and scale checks, adjust temporary diagnostics, and generate a redacted support bundle. | See below |
| Inventory Maintenance | Configure missing-inventory retention and Compression Tuning retention; run cleanup, purge, or reset actions deliberately. | Section 20 |
Change Tracking
Open Admin > Change Tracking, then:
- Enable or disable created, renamed, moved, updated, deleted, and excluded inventory events.
- Choose a retention period of 30, 90, 180, or 365 days, or Infinite.
- Set the maximum number of retained history events and save the settings.
- Use Purge History only when stored change events should be permanently removed. Purging preserves the current inventory and change-tracking configuration.
Keep change tracking enabled when administrators need to explain how inventory changed between scans. Disable it only when the storage and audit trade-off is understood.
Notifications
Open Admin > Notifications and configure:
- SMTP host, port, SSL/TLS, sender identity, and credentials.
- Enabled recipients, added separately from the SMTP settings.
- Scan-result messages for succeeded, failed, canceled, or skipped scans.
- Optional issue and change CSV attachments, including issue-severity and attachment-size limits.
- Auto Tune notifications and PI Interface runtime alerts only when those workflows are in use.
Save the SMTP settings and use Send Test before enabling operational mail. Runtime alerts wait two minutes to confirm a degraded state, exclude suppressed runtime issues, and can report Error, Unknown visibility, optional Warning, and recovery. Failed deliveries retry after 1, 5, and 15 minutes. Treat recipient lists and attached exports as operational data subject to the site's privacy and mail-retention requirements.
Security
Open Admin > Security to:
- Verify the effective Windows identity and assigned roles.
- Map Windows or AD groups to Viewer, Operator, and Admin.
- Review security health for the ACLs protecting ProgramData and bootstrap configuration.
- Use the audit view to identify who changed settings or initiated admin, scan, export, and support actions.
Use Viewer for read-only access, Operator for operational actions, and Admin for configuration and destructive maintenance. Local Windows Administrators may provide temporary bootstrap access, but configure an explicit enabled Admin group before production use.
Support
Open Admin > Support and use the tabs in this order when diagnosing an installation:
- Readiness: refresh the deployment checks and resolve blocking failures before scanning.
- Scale: review inventory size, recent scan runtimes, runtime by scope, and SQL memory evidence before planning large scans. Investigate warnings before adding scan volume; create a support bundle when the cause is not clear.
- Diagnostics: review the persistent base log level and use temporary Debug logging only for a bounded reproduction. Temporary Debug logging expires automatically and does not require a service restart.
- Support Bundle: select a time range and generate a bundle containing logs, runtime status, migration history, scan summaries, configuration summaries, and issue/dashboard summaries. Passwords, tokens, credentials, and connection-string secrets are redacted; full inventory exports are not included.
Send the generated bundle to support together with the application version, the affected scan or run ID, and the time the problem was reproduced.



