



PI Nexus+ / User Guide
Detail Dialogs
The detail dialog is the object-level investigation view. Its header shows the object's health and related-object counts, and the available tabs depend on the object type.
Overview
The detail dialog is the object-level investigation view. Its header shows the object's health and related-object counts, and the available tabs depend on the object type.
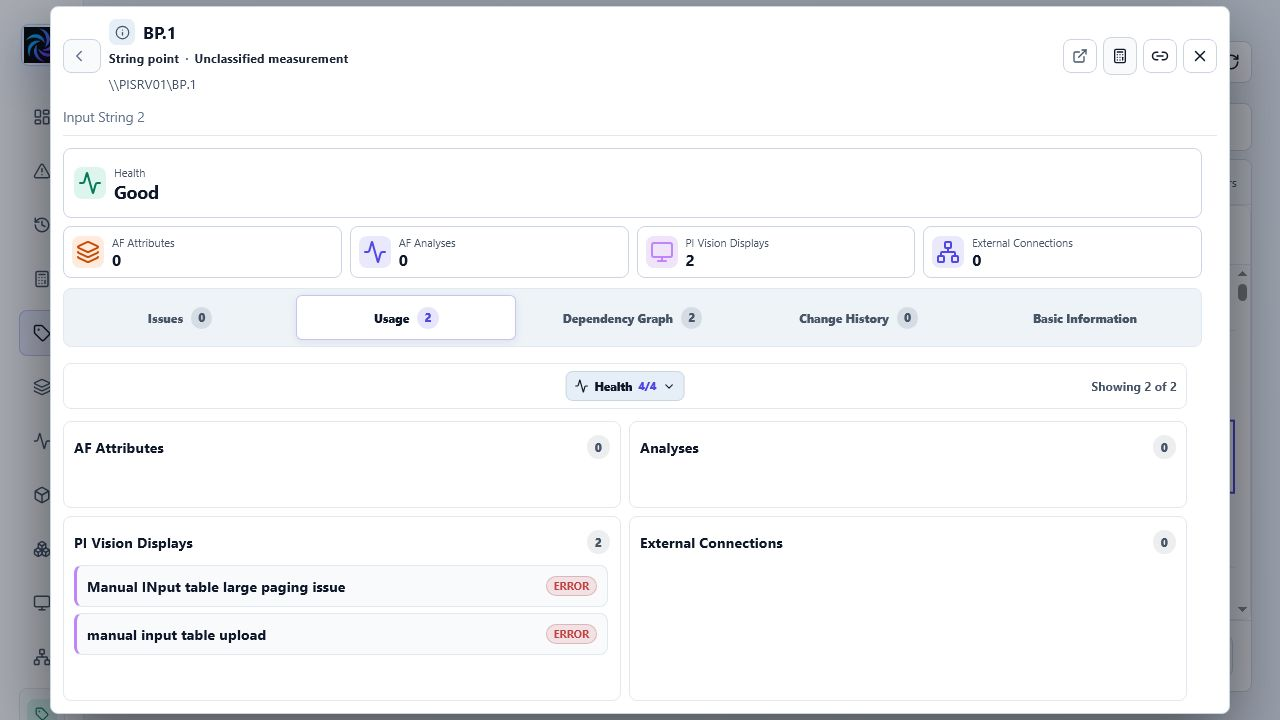
Common controls:
- Back returns to the previously opened object when you navigated through a dependency or related object.
- Copy link to this item copies a URL that reopens the same object detail.
- Open in PI Vision appears for PI Vision displays and supported PI Point links.
- Close exits the dialog.
- If an object has active unsuppressed issues, the dialog may open on Issues automatically. Otherwise, it opens on the most useful object-specific tab.
- Health filters in reference lists hide or show related objects without changing inventory state. Counts on tabs and header cards describe the current relationship or issue set; they are not always unique object totals.
Object-specific tabs:
| Object | Detail tabs |
|---|---|
| PI Point | Issues, Usage, Dependency Graph, Change History, Basic Information |
| AF Attribute | Issues, Datasources, Dependency Graph, Change History, Basic Information |
| AF Element | Issues, Attributes & Analyses, Change History, Basic Information |
| AF Element Template | Usage, Dependency Graph, Change History, Basic Information |
| AF Analysis | Issues, Usage, Dependency Graph, Change History, Basic Information |
| PI Vision Display | Issues, Usage, Dependency Graph, Change History, Basic Information |
The Issues tab shows active and suppressed unresolved issues. Usage, Datasources, and Attributes & Analyses show the relationships appropriate to the object. Dependency Graph visualizes supported relationships. Change History shows retained inventory changes, and Basic Information shows identity, definition, current state, context, and lifecycle details.
Object-specific detail behavior:
- PI Points show health, latest value quality and timestamp, matched PI Point rule information, AF Attribute usage, AF Analysis input/output usage, PI Vision display usage, external connections, and basic point metadata.
- AF Attributes show data references, linked PI Points, limit traits, parent element/template context, analysis inputs and outputs, PI Vision displays, current value, and definition metadata.
- AF Elements show grouped child-attribute and analysis health drivers, child object lists, template context, and element lifecycle. AF Elements do not currently have a Dependency Graph tab; use a child object's detail dialog for graph tracing.
- AF Element Templates show derived elements, issue concentration, template-scoped changes, and template identity.
- AF Analyses show input/output attributes, status, rule and time-rule information, performance and runtime indicators, and owning element/template context.
- PI Vision Displays show datasource health, usage status, PI Points, AF Attributes, AF Elements, calculations, display metadata, and a direct link to open the display.
- External Systems show their visual identity, derived Data Health, directional summaries, impact policies, support contact, safe runbook link, assigned PI Point Rules, a bounded dependency graph, and a searchable list of active or missing connected PI Points. PI Point rows open in the same detail stack, so Back and Copy Link continue to work.
Dependency Graph
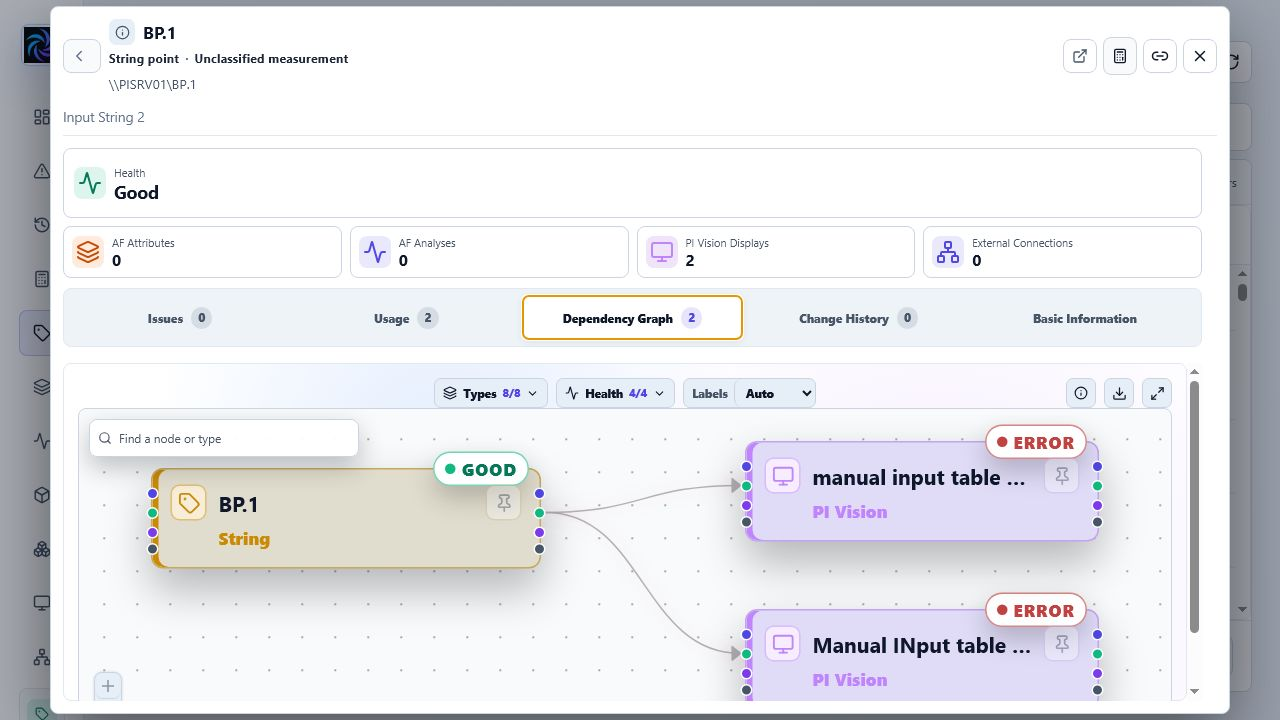
The dependency graph shows how objects relate to each other. Use it to find whether an issue starts at a source object or appears only in a downstream consumer.
Graph basics:
- Nodes are colored by object type, such as PI Point, AF Attribute, AF Element, AF Analysis, PI Vision Display, PI Vision Calculation, External System, or inferred External Source. External systems use their administrator-selected color as an identity accent.
- Health labels identify Good, Warning, and Error paths.
- Click a node to open that object in the same detail dialog stack. Missing objects and collapsed stack nodes are not opened as normal object details.
- Use the node controls to expand or collapse upstream and downstream dependencies. Large fan-outs are grouped into expandable stacks.
- AF Element nodes in asset context can expand their attributes and analyses. AF Attribute nodes can expose a Limits popover; open the attribute detail for the full limit context.
- Hover a node to preview its direct connections. Pin the node to choose Upstream, Downstream, or Both, select Direct or Full path, and optionally Isolate unrelated nodes.
- Use graph controls to zoom, pan, and fit the graph. Larger graphs show a minimap that can also pan and zoom.
- Search with Find a node or type, then use the previous/next buttons to center matching nodes.
- Use Types and Health to hide node categories or health states, and Labels to choose Auto, All, or None for edge labels. Dashed edges preserve paths through hidden nodes. Reset restores the filters.
- Use Export SVG for a scalable copy of the current graph and Open fullscreen when more canvas space is needed.
- If the graph is truncated, narrow the investigation or open related objects directly from Usage/Datasources tabs.
For PI Vision displays, Detail shows the explicit datasource and analysis chain, while Assets groups displayed attributes and analyses by AF Element. Template-backed displays open in Assets by default; other displays open in Detail. The view toggle is available only when the display has an asset-context projection.
For PI Points, an inbound external-system arrow means that the system supplies data to the tag. An outbound arrow means the tag supplies data to that system. The edge label describes the configured integration, and its tooltip names the PI Point Rule that defined it. If at least one curated inbound source is configured, PI Nexus+ hides the inferred InstrumentTag source to avoid showing the same origin twice. Removing the curated source makes the InstrumentTag fallback visible again without rescanning. Mapping changes are immediate for already classified points; rule matching or priority changes require a scan.
Click an external-system node to open its details and find the support contact or runbook during an incident. Its Dependency Graph shows the system as the root, sources flowing into PI Points, and PI Points flowing to targets. Ten or more PI Points with the same directional relationship are collapsed into an expandable stack. To remain responsive for systems linked to thousands of tags, the graph is capped at 60 total nodes and prioritizes missing, error, warning, and not-evaluated points before healthy points. A Limited view notice means the Connections tab is the complete, paginated inventory. That tab can be filtered to Sources or Targets and pages through unique active or missing PI Points. Its Good, Warning, Error, Missing, and Not Evaluated filters describe the connected PI Points themselves. External systems remain outside global inventory search.



