PI Nexus+ / Installation and Administration
17. Dependency Graphs
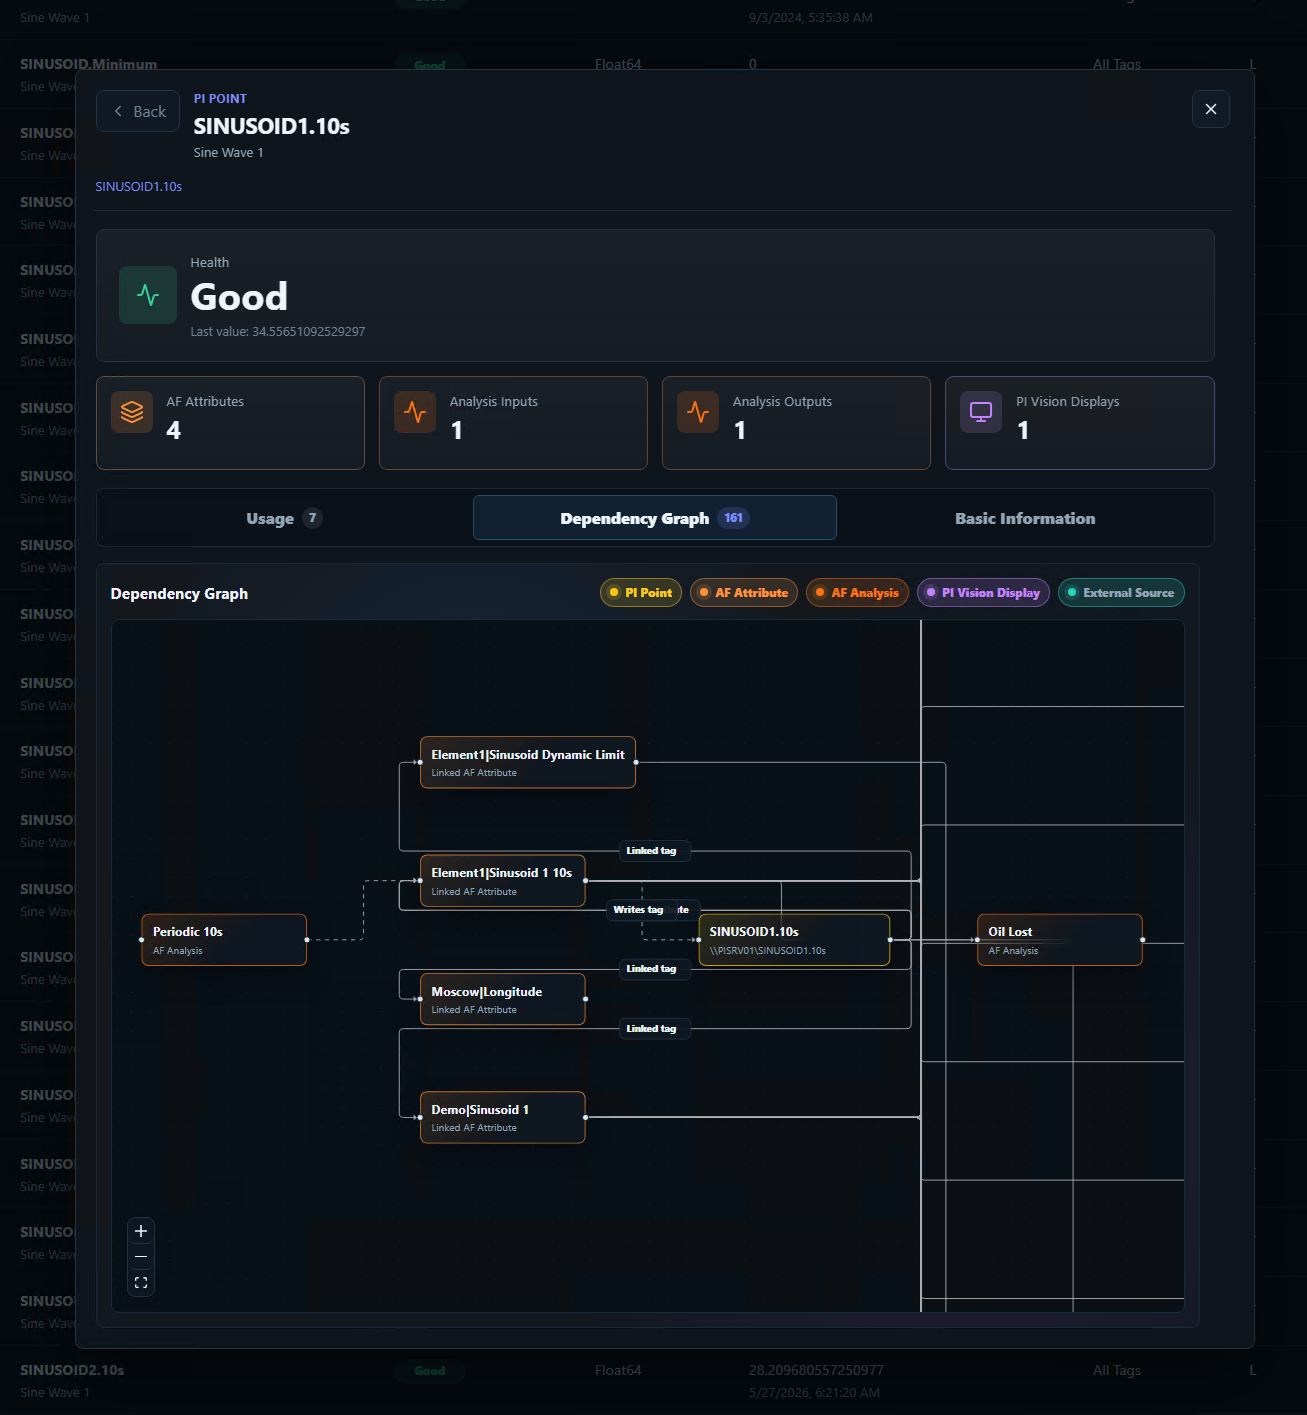
Dependency graphs help trace relationships between PI Vision displays, AF attributes, AF analyses, and PI Points. They are useful when investigating why an object is unhealthy or where a tag or attribute is used.
Overview
Dependency graphs help trace relationships between PI Vision displays, AF attributes, AF analyses, and PI Points. They are useful when investigating why an object is unhealthy or where a tag or attribute is used.
Dependency graphs can show:
- A PI Vision display and the datasources it uses.
- An AF attribute and its analyses, PI Point, PI Vision displays, and limit traits.
- An AF analysis and its input/output attributes.
- A PI Point and the AF attributes or displays that depend on it.
- A configured inbound external system feeding a PI Point, or an outbound external system receiving PI Point data.
Graph nodes show object category and health. Error-related paths are highlighted where available so an administrator can follow the likely source of a problem.
External-system nodes use their configured icon and color as an identity accent; arrows, labels, and health styling remain separate signals. Their health represents the complete external system's connected PI data, even when the current graph displays only some of its points. Edge tooltips identify the PI Point Rule that defines the connection. Curated inbound systems replace the InstrumentTag-derived source. When no curated inbound assignment exists, the inferred InstrumentTag source is preserved as a fallback. Opening an external-system detail provides support contacts, runbooks, assigned rules, policies, paginated active or missing PI Points, and a root dependency graph. The root graph is server-bounded to 60 total nodes, orders missing and unhealthy points ahead of healthy points, and groups ten or more PI Points with the same directional relationship into an expandable stack. Truncated results are marked as a limited view; use Connections for the complete set.
For PI Vision display graphs, AF limit trait attributes are hidden as separate nodes to avoid clutter. They are still visible from the base AF attribute details.
A good result for this section is that dependencies match the expected PI System model and unhealthy paths can be traced without opening many separate pages.