



PI Nexus+ / User Guide
AF Analyses
The AF Analyses page shows AF Analysis health and performance-oriented scan data.
Overview
The AF Analyses page shows AF Analysis health and performance-oriented scan data.
Disabled, stopped, and not-ready analyses remain visible with their configuration and dependency information, but PI Nexus+ does not execute their rules during inventory health evaluation. Service-load and runtime metrics apply to running analyses.
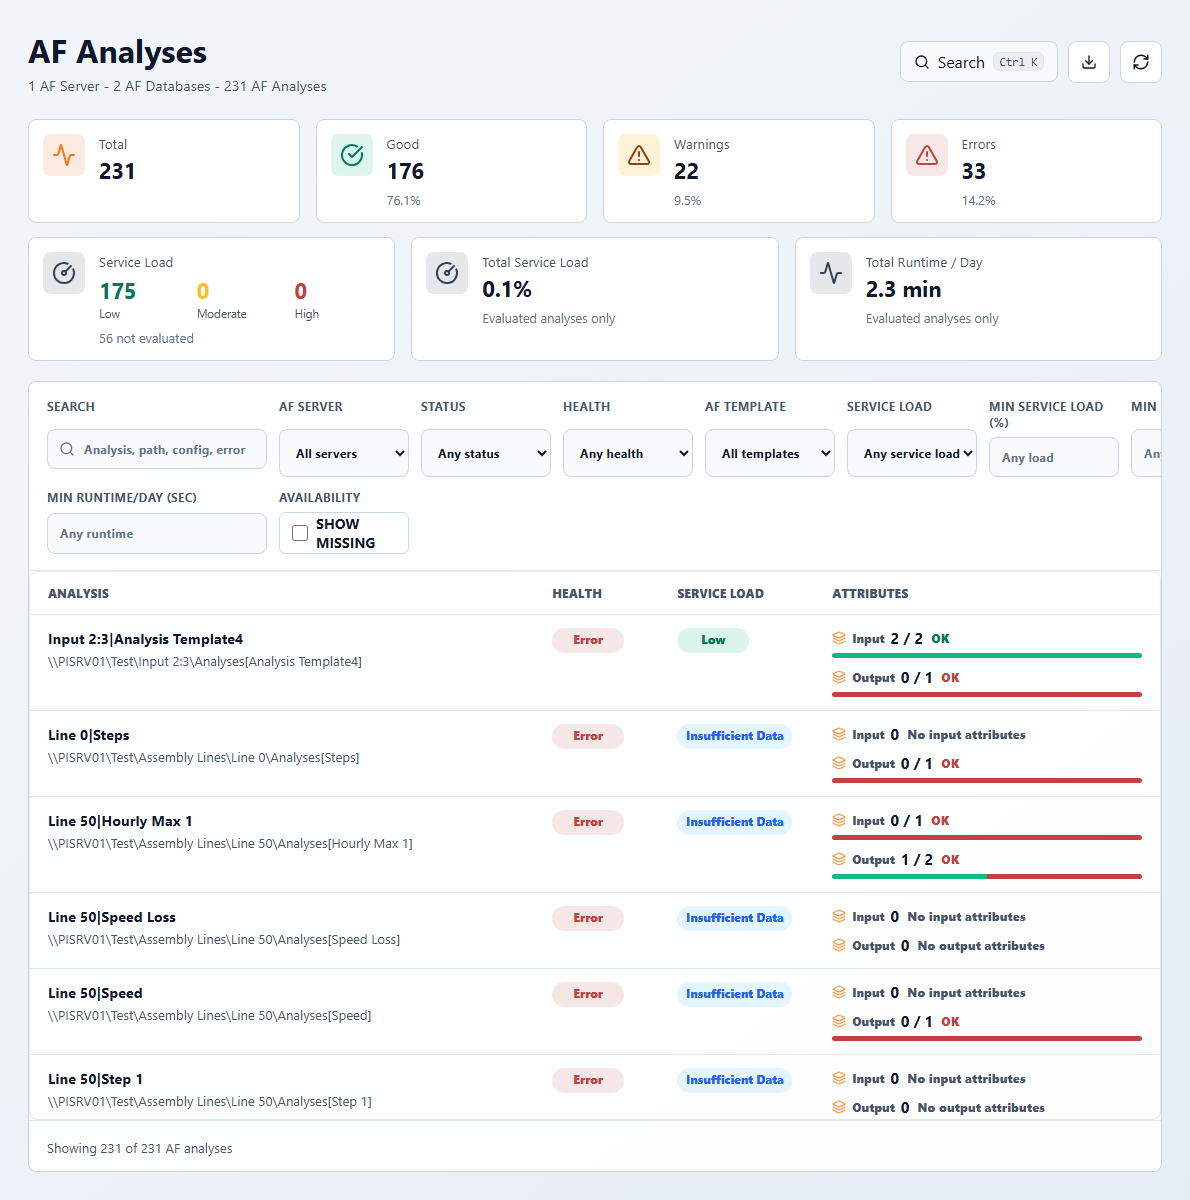
Use this page to answer:
- Which analyses are broken, warning, or healthy?
- Which analyses have high service load or runtime per day?
- Which input or output attributes are unhealthy?
- Which analysis status or rule type is associated with issues?
Key KPIs:
- Total: active AF Analyses in the current filtered view.
- Good: analyses currently healthy.
- Warnings: warning-level analysis health.
- Errors: error-level analysis health.
- Performance cards: service-load and runtime summaries for evaluated analyses.
Useful filters:
- Search by analysis, path, configuration, or error text.
- Filter by AF server, status, health, AF Template, or service-load status.
- Filter by minimum service load, elapsed seconds, or runtime per day.
- Enable Show missing to include analyses not found in the latest scan.
Open an AF Analysis to inspect inputs, outputs, owning element/template, status, rule configuration, performance details, and dependency graph.
AF Analysis detail
The header summarizes health, input attributes, output attributes, analysis status, and service load. Usage separates input attributes, output attributes, and other references, with health filtering for the related objects.
Basic Information includes owning element/template context, identity and inventory state, status, analysis rule, time rule and interval, health/error messages, service load, average elapsed and trigger times, execution count, error and skip ratios, runtime per day, and last scanned. When available, the raw analysis-rule and time-rule configuration is included for troubleshooting.



